Issue, No.22 (June 2022)
Unpacking Poverty in Luxembourg: Evolution of Poverty Rates by Household Type and Immigration Background- 2015-2019
Introduction
Besides being the home of LIS, Luxembourg is one of the richest countries in the world with GDP per capita reaching 116,356.2$ (current prices) in 2020 [source: World Bank], with a striving economy and a low unemployment rate, estimated at only 4.7% in April 2022 [source: STATEC].
The small country located in the heart of Europe, is characterized by its diversified population, being also one of the main administrative headquarters of the European Institutions and other supranational organisations. The share of foreigners in the Luxembourgish population almost doubled in the past 40 years, increasing from 26.3% in 1981 to 47% in January 2022 [source: STATEC]. In 2020, the employees of European Institutions in Luxembourg were estimated at 14.000 [source: Wort who compiled data from various supranational institutions]. In addition to foreign resident population, the Luxembourg has a large share of cross-border workers, it was estimated that in 2021 46,34% of the labour force comes every day from across the borders, mostly from France, Belgium and Germany [source: STATEC].
This unique composition of the Luxembourgish society and its strong economy makes it an attractive place for work and life to many foreigners from Europe and all over the world. However, in later years poverty started to be a matter of concern, especially among children and even among the working population. ‘ The Risk of Poverty Continues to Increase in Luxembourg’-this is the headline of a recent newspaper article published in one of the main journals in Luxembourg [source: Wort.lu]. This article is one of several over the last couple of years that addressed the increase of poverty rates in Luxembourg.
Indeed, poverty is on an increasing trend in the last decades, but is it increasing at the same pace for all? A STATEC report (that made also the news in the national media) from 2019, using, among other sources, the same original data that LIS has now harmonised, identifies as the most vulnerable groups to poverty the unemployed, the foreigners and the single parents. However, the unemployed group is problematic to adequately be captured in the survey of the resident population due to the large share of the cross-border work force. Thus, in this article we will focus on immigration background and different household types in order to identify the groups with high poverty rates and observe their evolution over the latest 5 years with the newly added data points in LIS database 2015-2019.
Data and concepts definitions
Luxembourg is part of the LIS database since the creation of the LIS project in the beginning of the ‘80s, with data ranging from 1985 to 2019. The first two datasets in the series are based on the first Socio-economic Panel ”Living in Luxembourg”/ Panel Socio-Economique ‘Liewen zu Lëtzebuerg’ (PSELL1), the datasets for 1997 & 2000 are based on PSELL II and the data from 2004 till the most recent year on PSELL III (that is also used as input for the EU-SILC database). Until 2013 the original data was provided by the Luxembourg Institute of Socio-Economic Research (LISER) and since 2015 by the National Institute of statistics and economic studies of the Grand Duchy of Luxembourg (STATEC). In PSELL III the rotational panel sample was drawn until 2016 from the Luxemburgish Social Security administrative database (same selection base for PSELL I & II), which means that only households that had at least one member affiliated to the national social security had a chance to be selected, while from 2016 the sample that renewed the rotational panel started to be drawn from the National Population Register, meaning that also households with employees of the supranational organisations (that belong to a different social security system than the national one) residing in the country and thus registered in the National Population Register, had equal chances to be selected in the sample. Hence, we can observe a break in series in the data around the year 2016, as well as 1994 when PSELL II replaced PSELL I with a different sample.
For defining relative poverty, we use the methodology applied by EUROSTAT, which defines relative poverty as a headcount ratio, the proportion of a population living in households whose income falls below a poverty line. In the following, these poverty line thresholds are defined as 40%, 50%, and 60 % respectively of equivalised disposable household income. LIS defines disposable household income as the sum of monetary and in-kind1 income from labour, capital, pensions and monetary and in-kind public social benefits, as well as the monetary and in-kind private transfers, from which the income taxes and social contributions paid are deduced. Equivalisation is carried out by using the modified OECD scale, which counts as 1 unit the first adult in the household, 0.5 the other adults and the children aged 14 to 17 and with 0.3 the children aged 13 or younger in order to account for economies of scale in larger households.
Poverty rates evolution over time: 1985-2019
In order to have an overview of the evolution over time of poverty in Luxembourg, in Fig. 1 below we show the poverty rates below 60% of median equivalised disposable income for total population, elderly aged 65 or above, and children below the age of 18.
Figure 1. Relative poverty rates for total population and age groups (1985-2019)
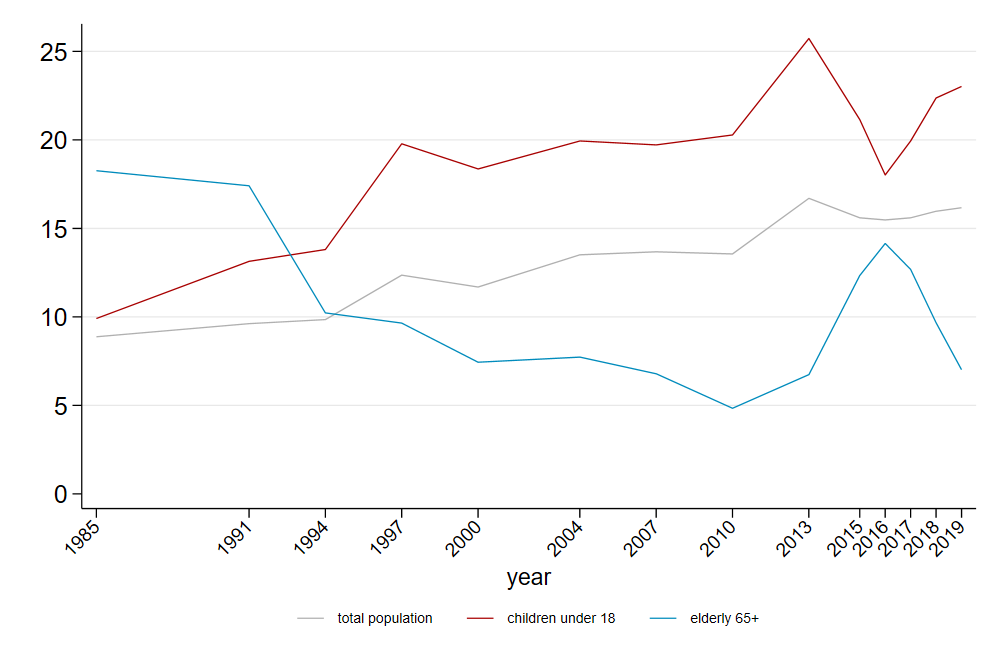
Notes: Poverty rates are calculated as headcount ratios, i.e. percentage of each (sub)population with equivalised disposable income below 60% of median equivalised disposable income; disposable household income is equivalised using the OECD modified scale.
Source: Luxembourg Income Study (LIS) Database.
We can see that overall poverty rate is increasing in a slow pace over time, nevertheless with a divergent trend for population subgroups. The elderly population aged 65 and above has experienced over time lower poverty rates (however with a peak in 2016), whereas in recent years particularly children below age 18 have become a main group at risk. In 2019, poverty among the elderly has been one third of the poverty rate among children. Poverty risk for children concerns almost every fourth child in Luxembourg. Given this increased risk, in the next step, we look into different types of households, with children and without. In a second step, we will also introduce a second dimension referring to the immigration background to account for the diversity among the Luxembourgish society, which in a later stage we will combine to better assess which particular group is more vulnerable against poverty. We selected individuals aged 25-59, focusing on families with children below age 18 in comparison with other household types.
Poverty rates by household type: are families with children at higher risk?
Figure 2. Relative poverty rates by household type
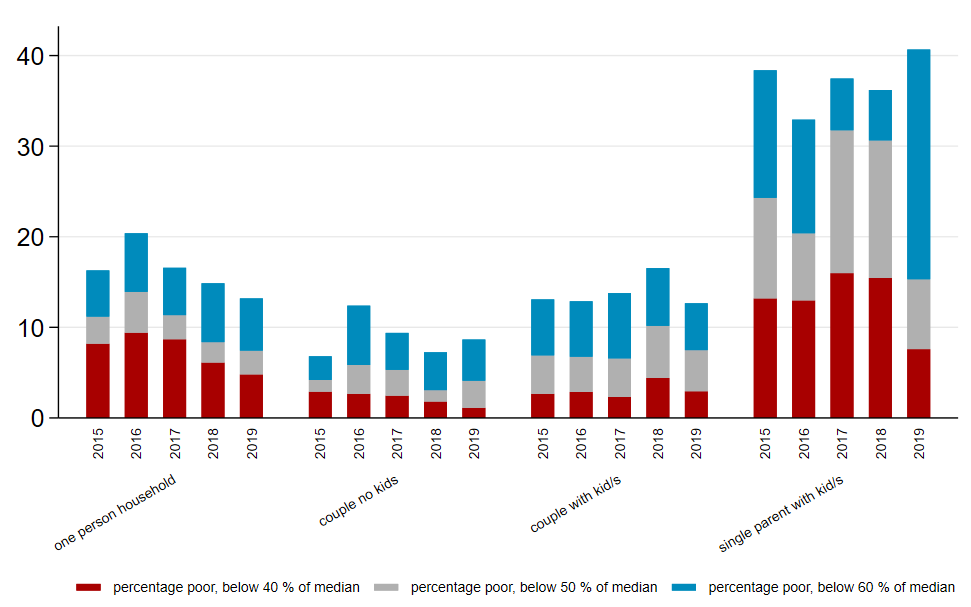
Notes: Poverty rates are calculated as headcount ratios, i.e. percentage of each sub-population group with equivalised disposable income below each threshold 40/50/60% of median equivalised disposable income; disposable household income is equivalised using the OECD modified scale. The sample is restricted the population living in households where the head is aged 25-59.
Source: Luxembourg Income Study (LIS) Database.
In Fig. 2 we look at poverty rates by different household types, distinguishing between 1 person household, couple with no children, couple with 1 or more children under the age of 18, and single parent with 1 or more children under the age of 18. The households with children were restricted to those having all children present in the household under 18 years of age. By far the most at risk of poverty group is the one of single parents, with poverty rates of around 40% in 2019, slightly increasing by 3 percentage points over the five year period. The second highest poverty rates are observed in the other household type that has only the financial resources of just one adult: the one person household. After a peak in 2016 at 20% poverty rate, one person households are on a decreasing trend, reaching in 2019 the same level as the couples with 1 child or more, at 13%. Looking further at couples, we observed that couples with child/ren have, as expected, higher poverty rates than childless couples in all years, nevertheless significantly decreasing in the last year. The fact that the difference is rather small could suggest a successful effect of children benefits when the income of 2 adults are pulled together, the presence of children does not increase poverty rates as much as for households with only 1 adult.
Poverty rates by immigration background: are the foreigners much worse off?
In a second step, we look at poverty rate by citizenship and immigration background, distinguishing between Luxembourgish, EU or EFTA 2 citizen and third country citizens. In case someone holds multiple citizenships, the citizenship of the resident country has priority. Furthermore, among Luxembourgish, we used the country of birth of the parents as a proxy for second generation immigrants and naturalised citizens and we distinguish between: Luxembourgish with both parents born in the country; with only one parent born in the country and the other abroad, and with both parents born abroad.
Figure 3. Relative poverty rates by citizenship and immigration background
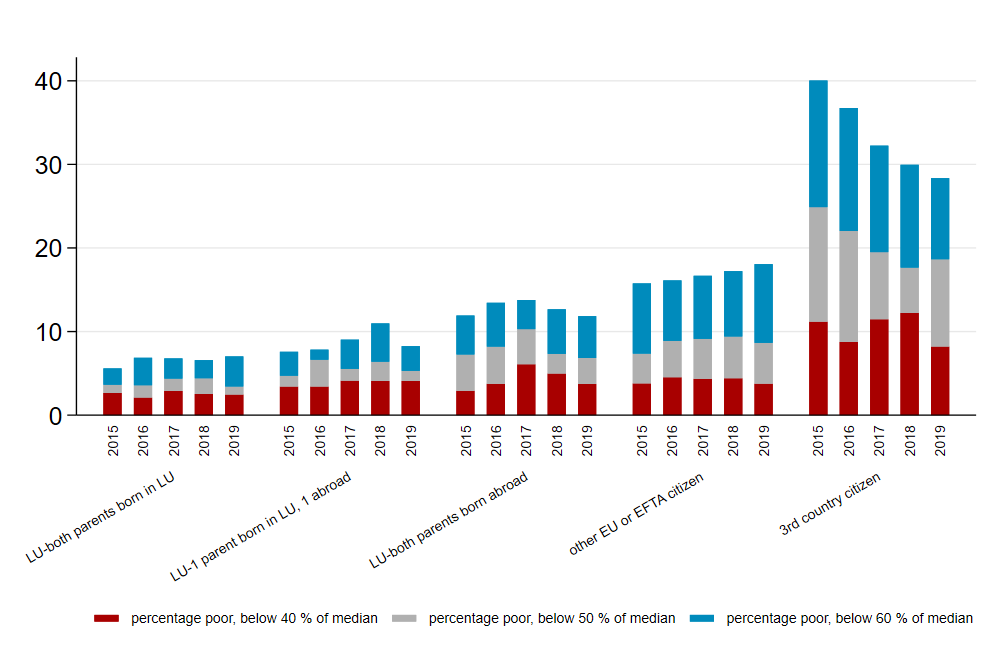
Notes: Poverty rates are calculated as headcount ratios, i.e. percentage of each sub-population group with equivalised disposable income below each threshold 40/50/60% of median equivalised disposable income; disposable household income is equivalised using OECD modified scale.. The sample is restricted the population aged 25-59.
Source: Luxembourg Income Study (LIS) Database.
We can observe from Fig. 3. that the poverty rates for the third country nationals are by far the highest, more than double than EU & EFTA citizens in the first 2 years, however in a constant and significant decreasing trend, while the poverty rates for EU & EFTA citizens which are the second highest are in a slightly increasing trend over the year. The difference between the two groups of foreigners decreased from a remarkable 24 percentage points to only 10 over the 5 years period. An explanation could be also the fact that UK citizens changed categories in 2019 from EU to third country citizens after the BREXIT. They are the 7th largest international community in Luxembourg and they represented 0.7% of the sample in 2015, however it decreased to 0.4% of the sample in 2018 & 2019 due mainly to them getting another EU nationality just before BREXIT to conserve their rights. We also want to highlight that EU & EFTA group is quite heterogeneous, besides highly qualified individuals that work for international institutions or financial markets and not only, there are also a large group working in less qualified and less well paid jobs3.
Among the Luxembourgish nationals we can see that, in the first years, the poverty rates were double for those with both parents born abroad compared with those with both parents born in the country, who have the lowest poverty rates of all categories, despite a slight increase on 1 percentage point over the years. The poverty rates of second generation or naturalised citizens, despite small variations over the years, remain stable at about 12%. Luxembourgish with only one parent born in the country, despite a peak in 2018, seem to have closer values to the ones with both parents born in the country, that have the lowest poverty rates. Therefore, even among Luxembourgish citizens, we observe variations in poverty rates depending on their immigration background.
Poverty rates by household type and immigration background of head (and partner)
Next, in Fig. 4 below, we combine the two previous groups, the type of household (the categories remain the same as described above) and citizenship. Due to the small size of certain combined groups 4 we had to regroup our initial citizenship variable and distinguish only between nationals and foreigners and for couples we looked at the citizenship of the head and spouse, therefore they can be: both Luxembourgish, both foreigners or a mixed-couple (with or without children).
Figure 4. Relative poverty rates by selected household type and citizenship
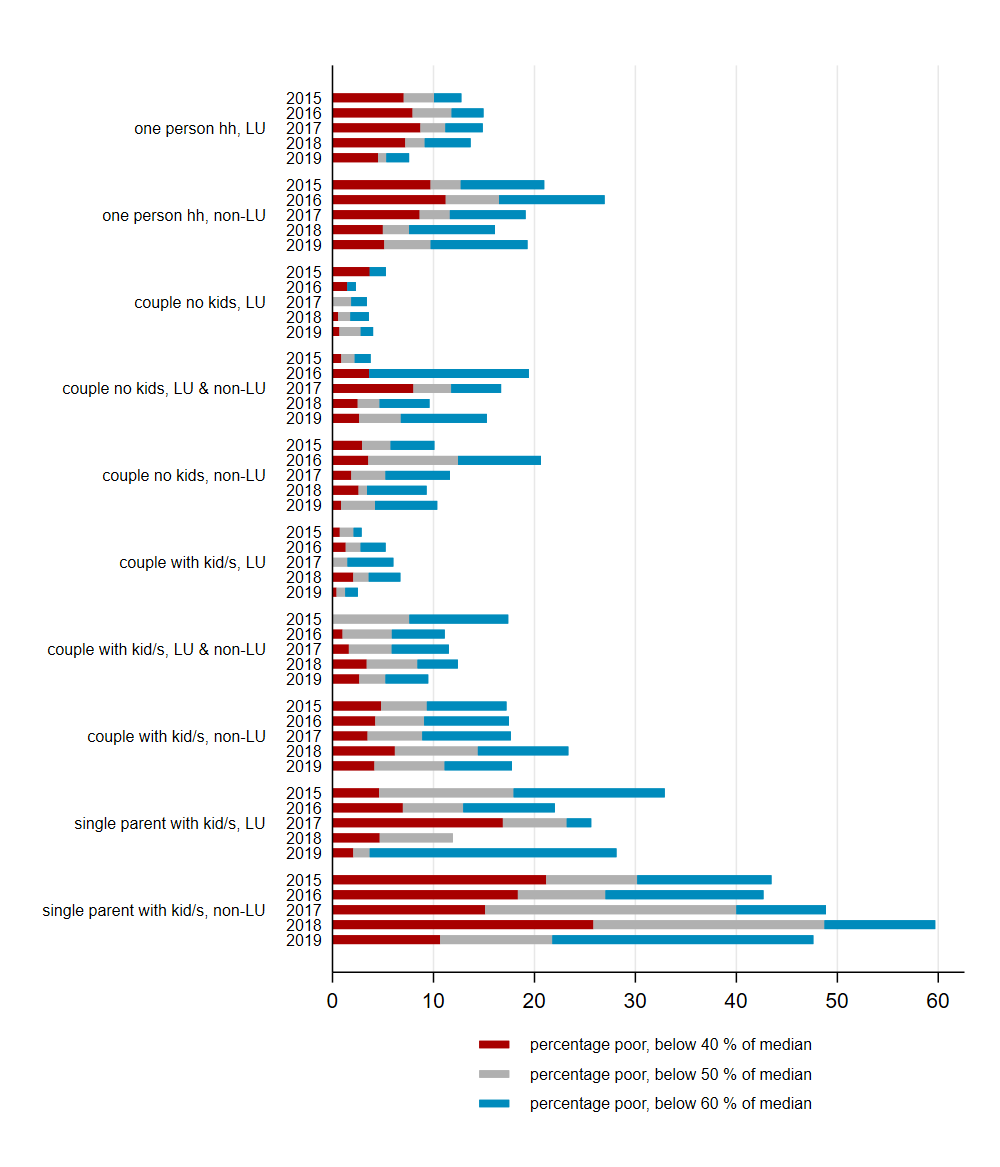
Notes: Poverty rates are calculated as headcount ratios, i.e. percentage of each sub-population group with equivalised disposable income below each threshold 40/50/60% of median equivalised disposable income; disposable household income is equivalised using the OECD modified scale. The sample is restricted to households, where the head of household is aged 25-59.
Source: Luxembourg Income Study (LIS) Database.
The poverty rates are by far the highest in all years, among foreigner single parents. On the second highest place are Luxembourgish single parents, which, nevertheless, have slightly lower poverty rates in 2019 compared to 2015. Not far behind them are the foreigners living alone that have even higher poverty rates in 2019 than the couples with child/ren, regardless of their nationality.
Luxembourgers living alone have higher poverty rates than their conationals living in couple, with or without children. Although in a decreasing trend in the last years, their poverty rates are by 5 percentage points higher than Luxembourgish families with child/ren.
Among the couples with child/ren, the foreigner parents have the highest poverty rate, as expected, while at the opposite side, Luxembourgish families with child/ren have the lowest poverty rates among all groups, only 3% in 2019, even lower than childless Luxembourgish couples. Mixed couple with child/ren are in between the two groups, experiencing in 2019 half of the poverty rate of the foreign families with child/ren, in a decreasing trend over the years.
Among the couples without children, the overall differences are small between foreigners and mixed couples, nonetheless in 2019 the mixed couples have higher rates by 5 percentage points than foreigner childless couples. The most noticeable is that among Luxembourgish, the couples with child/ren have similar (very) low rates to the couples without children, showing that in their case the presence of child/ren in the household does not have a significant impact on their poverty risk.
Conclusions
Combining the two groups, we saw that highest poverty rates are among single parents, especially when they are foreigners and in the second place among one person households, with foreigners living alone having higher poverty rates than their Luxembourgish counterparts. The report by STATEC ( 2019) on employment and social cohesion in Luxembourg; also confirms that single parents and one person households have higher poverty rates compared with other household types and foreigners (especially non-EU) have higher rates than nationals.
If we take into account the nationality, among Luxembourgers does not seem to be a significant difference in the poverty rate of couples with and without children, and the same stands for mixed couples. This could indicate a successful impact of family policies; however this leaves several groups at risk: the foreign parents, especially when they are single parents.
The second group most at risk of poverty are the persons living alone, and especially the foreigners among them who are often neglected in poverty research. They would have even higher poverty prevalence if the housing costs would be taking into account. Housing costs was estimated by STATEC for 2019 at 54% of the budget for one person living alone compared with under 40% for couples without children or single parents and down to 31% for a couple with two children. Therefore, housing policies providing more affordable housing options would improve particularly the situation of persons that live alone. They will be the ones who will most benefit of the long-term planned taxation reform and moving towards individual taxation of income, since currently they are the ones paying the highest taxes from all the tax classes.
Household structure and immigration background are only a few among various other factors such as education level, activity status, and work intensity, which jointly influence poverty prevalence. Regression techniques are needed to carefully assess these factors combined in order to determine their impact on poverty risks, so that comprehensive policy recommendations can be made in order to help the government to make relevant policies in order to decrease poverty among the vulnerable groups.
1 One limitation is that the in-kind transfers are not well captured in the data, for example STATEC report [2022] shows that taking into account the child care vouchers “chèques-service accueil” in the calculation of the disposable income, decreases the poverty rate by over 1 percentage points for families with young children.
2 European Free Trade Association (EFTA) from which are part Iceland, Liechtenstein, Norway and Switzerland gives to their citizens similar rights as EU citizens on The European Economic Area (EEA).
3 For ex. about 13 % of them work in construction sector, while the similar percentage work in financial sector in each year, while the proportion of those who work in supranational organisations doubled in the sample reaching 12% in 2019, but this is due to the change in sample selection as well (source: LIS data).
4 Please note that, despite regrouping, certain categories, more specifically the two single parents groups are rather small (between 2% & 3 % of the sample in each year), therefore their poverty rates are to be regarded with caution.