Issue, No.24 (December 2022)
Welfare and Distributional Impact of Soaring Prices in Europe
Introduction
The outbreak of the COVID-19 crisis at the beginning of 2020 and the start of the war in Ukraine two years later resulted in a record surge of prices around the globe. The average inflation rate across Europe during this period rose at an unprecedented rate since the 1980’s, with an increase in prices equivalent to 10 years prices growth over this period (Figure 1). Price growth was predominately driven by increases in fuels as a result of the Ukraine conflict, although most goods and services have seen price growth, especially food. Price inflation has been impacted by a number of other macro-economic changes including the impact of BREXIT, supply chain constraints post COVID-19 and an accumulation of building house price pressures since the recovery from the financial crisis of 2008-2009. In particular, we note that the price growth varies substantially across countries, reflecting different consumption patterns, mitigating policies and import origins. Eastern European countries tend to have the highest price growth, while the Nordics have the lowest price growth.
Figure 1. Year-to-year average inflation rate in the European Union
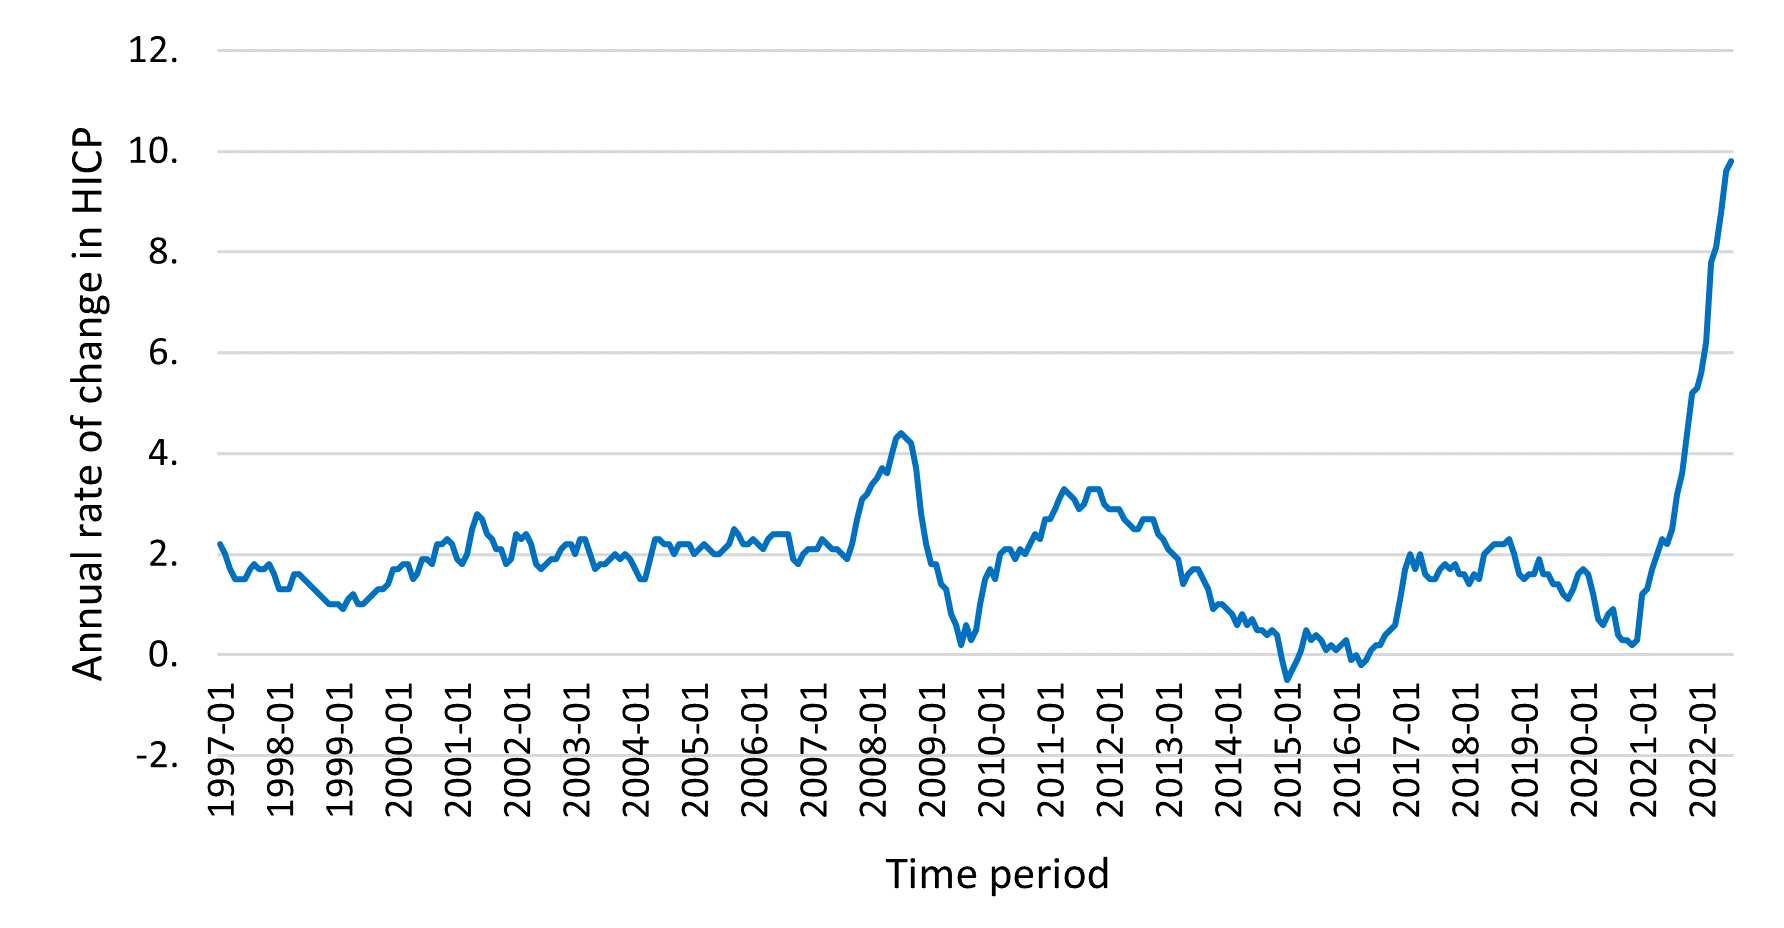
Source: Eurostat (accessed on 24 October 2022).
As these price changes affect different groups differently in different countries, we attempt to understand the differential impact of these changes across the income distribution comparatively across several European countries since the start of the cost of living crisis in early-2021 and mid-2022. We choose a subset of countries with different inflation experiences in the EU and with different welfare policies to address the cost of living crisis : Finland, Hungary, Ireland, Lithuania, Luxembourg, and Portugal. The comparative angle demonstrates to what extent the distributional and welfare consequences of inflation originating from the same energy crisis differ across countries with different consumption patterns, different levels of dependency on energy imports, and different welfare systems.
The comparative advantage of this paper lies in combining a detailed decomposition of the impact of inflation with welfare changes measured using the compensating variation and equivalent incomes in a cross-national comparative perspective in relation to the cost of living crisis.
Methodology and data
We propose two methodological innovations. First, in evaluating the distributional impact of inflation, we go beyond existing studies and adapt a technique usually applied to assess progressivity/regressivity of tax-benefit systems. Building upon Pfähler (1990), we examine the interaction between the inflation rates of different commodity groups and the structure of expenditure in determining the overall levels of progressivity or regressivity of inflation in each country and assess its drivers by components. Second, in evaluating the welfare impact of price changes we build upon Creedy (2000) and O’Donoghue (2021) and develop a comparative microsimulation infrastructure aimed to obtain a money-metric measure of the change in welfare experienced by individuals due to price changes across Europe. We examine the way compensating variations resulting from price changes vary with household income. The approach consists of estimating a demand system to model household expenditure patterns on groups of goods in each country, estimate income and price elasticities and assess consumer welfare comparatively across Europe. We use the latest expenditure information from the Household Budget Survey (HBS) and price changes published by EUROSTAT, taking as reference the prices from 2021 April.
Distributional impact of inflation
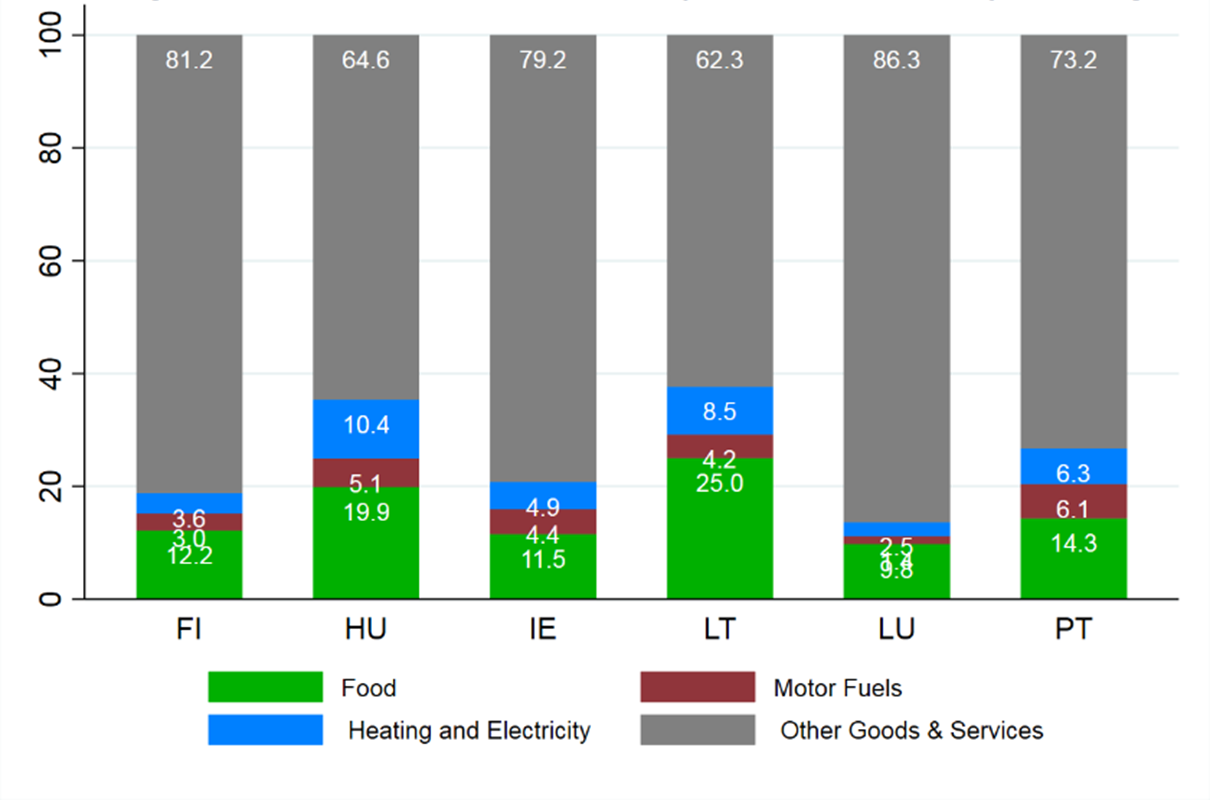
The impact of inflation depends on the combination of good-specific price increases and budget shares. Figure 2 shows the budget shares of the main commodity sub-components for the average household across the six countries. Typically, budget shares for necessities such as food, domestic fuels and electricity are higher in poorer countries such as Lithuania, Hungary and Portugal. Combined with a higher price growth in these necessities, this has resulted in higher inflation in poorer countries, with very significant cross-country variability.
Figure 2. Aggregate Budget Shares
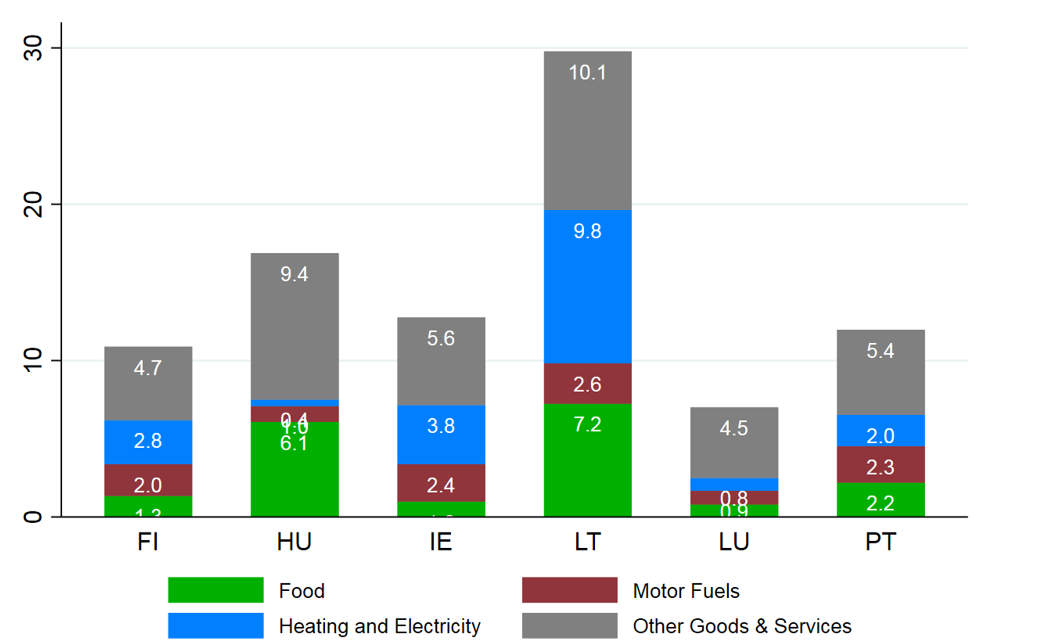
In Figure 3 we report inflation in July 2022 for the average household, built on both the budget shares and good commodity price change. Headline inflation was the highest in Lithuania and Hungary, and the lowest in Luxembourg.
The drivers of inflation vary across countries, with increases in energy and food prices being the main drivers of cross-national differences. Rising food prices contributed much more significantly towards inflation in Hungary (6.1 %) and Lithuania (7.2 %) relative to Luxembourg (0.9 %). Food prices have increased rapidly in Hungary and particularly for bread, dairy products and some meat products (Hungarian CSO, 2022). The contribution of increasing food prices towards overall CPI inflation is largest in the case of Lithuania (7.2 %) where rising prices for bread and dairy products are contributing heavily (Statistics Lithuania, 2022a).
The largest contribution towards inflation in Lithuania emerges from heating and electricity, contributing to a 9.8 % increase. Lithuania has experienced high inflation previously during the 2007/2008 commodity price spike. However, the inflation rate in the region of 30 % has not occurred since the transition to independence in the early 1990s.
In all six countries, rising prices are very evident for other goods and services with these expenditures raising inflation by a minimum of 4.5 % (Luxembourg) and a maximum of 10.1% in Lithuania.
Figure 3. Estimated inflation by main sub-components
The composition of expenditure across the income distribution (quintiles) within each country (Figure 4) varies substantially; shares of food and energy (necessities) are higher for low-income households and decline with income. Thus, large swings in necessity prices will affect low-income households more than higher income households. They also have a reduced ability to tap into savings, as shown in Figure 5, which illustrates the expenditure and savings shares in household income. We find a lower gradient, both in levels and distributional pattern in richer countries (Finland and Luxembourg), which also have similar shares of heating along the distribution. Budget shares for motor fuels tend to increase with income and this is most evident in Hungary.
Figure 4. Budget Shares of expenditure components across equivalised disposable income quintiles
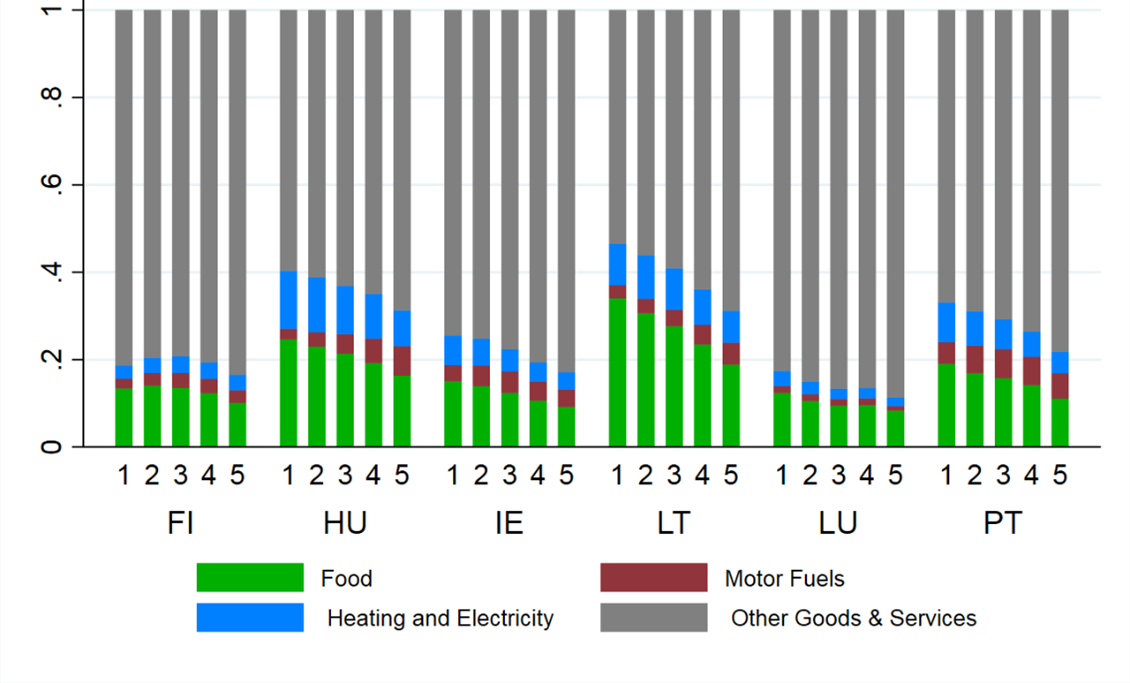
Figure 5. Budget and savings shares in household income across equivalised disposable income quintiles
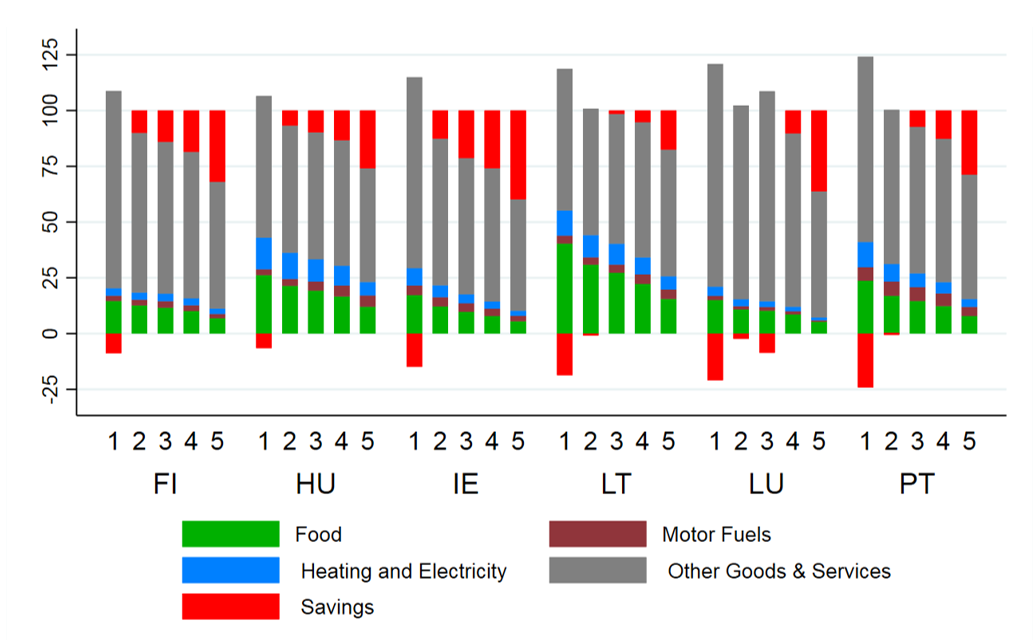
Figure 6 shows inflation in July 2022 relative to April 2021 along quintiles of household disposable income, built up from main commodity sub-components. The distributional impact varies across countries. We find a regressive impact of inflation in Lithuania and Ireland, a progressive impact in Finland, and a relatively flat effect in the other countries. We find a regressive impact of food inflation in most countries, however more pronounced in Hungary and Lithuania, meaning a larger percentage of inflation is driven by food for low-income households than for high-income households. For heating and electricity, we find a regressive impact, more pronounced in Lithuania and Ireland, which recorded higher price increases than the other countries: in Lithuania, liquid and solid fuels increased by 91% and 137%, gas by 103% and electricity by 72%; in Ireland liquid and solid fuels increased by 72% and 34%, gas by 62% and electricity by 42%.
Figure 6. Distributional impact of inflation across equivalised disposable income quintiles
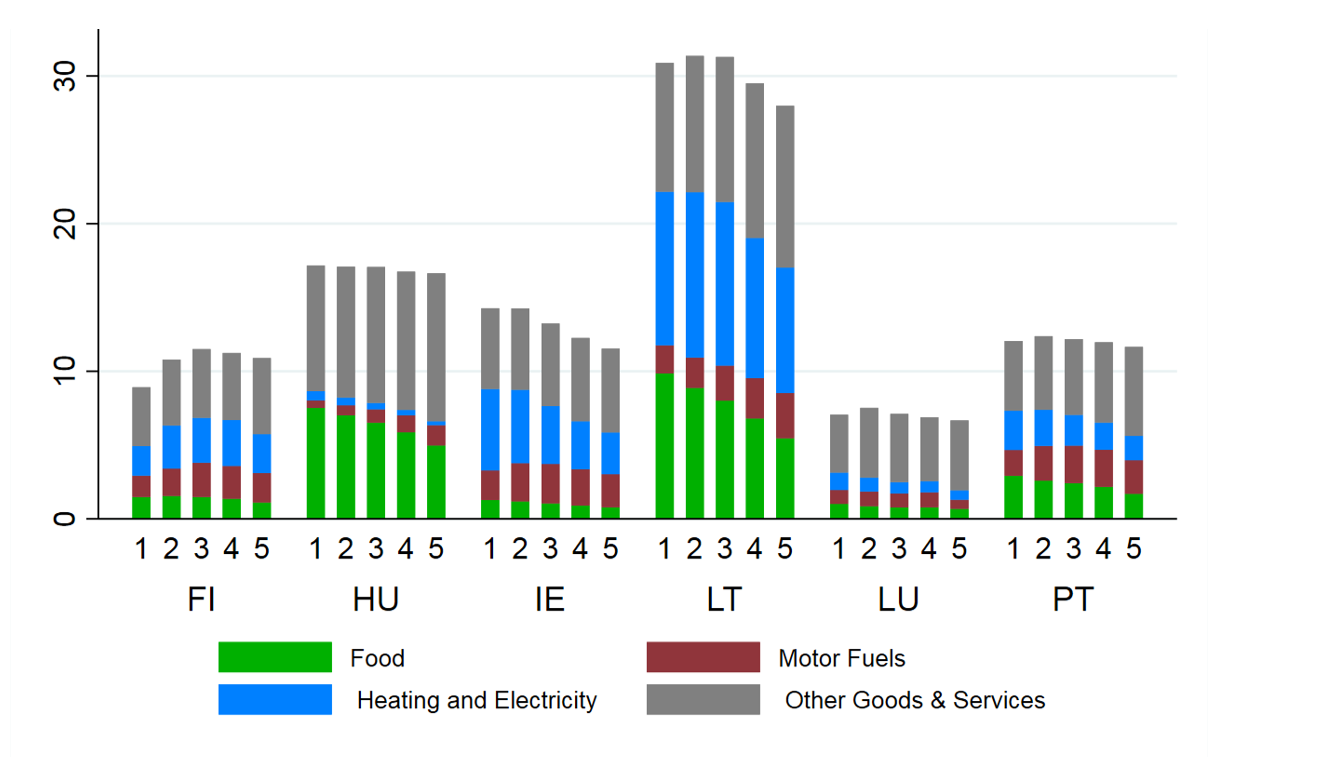
We find a low impact of heating and electricity in Hungary, which is surprising given the large shares in consumption. A closer look at price changes, however, reveals that the price of energy changed little in Hungary compared with the other countries. For example, the price of electricity stagnated, gas increased by 0.9%, and liquid and solid fuels increased by 11%. These differences may be influenced by policy decisions with price capping and reductions in indirect taxation having direct effects on inflation indices. This contrasts with the influence of ex-post subsidies, which may have no direct impact on inflation.
In Finland, the distributional pattern of energy inflation is inverted-U shaped, which can be explained by the composition of the energy basket and the price changes: the bottom of the distribution has higher shares of electricity in home heating, whereas the top has higher shares in liquid fuels. The price of liquid fuels, which are cheaper than electricity, increase by 99%, whereas for electricity the price increased by 34%. Thus, in Finland, the bottom of the distribution was less affected because it relies more on electricity, which increased much less compared with liquid fuels. Luxembourg has a much smaller inflation impact compared to Finland, despite having similar expenditure shares. This is due to lower price increases in Luxembourg, where liquid fuels increased by 36% and electricity by 2.6%. Gas and solid fuel prices increased by similar amounts in both countries (29-48%).
For motor fuels, we find a progressive inflation impact, except in Luxembourg where the effect is homogenous except the top quintile (lower). For other goods and services, we find a progressive impact, except in Ireland where the pattern is flat along the distribution of income.
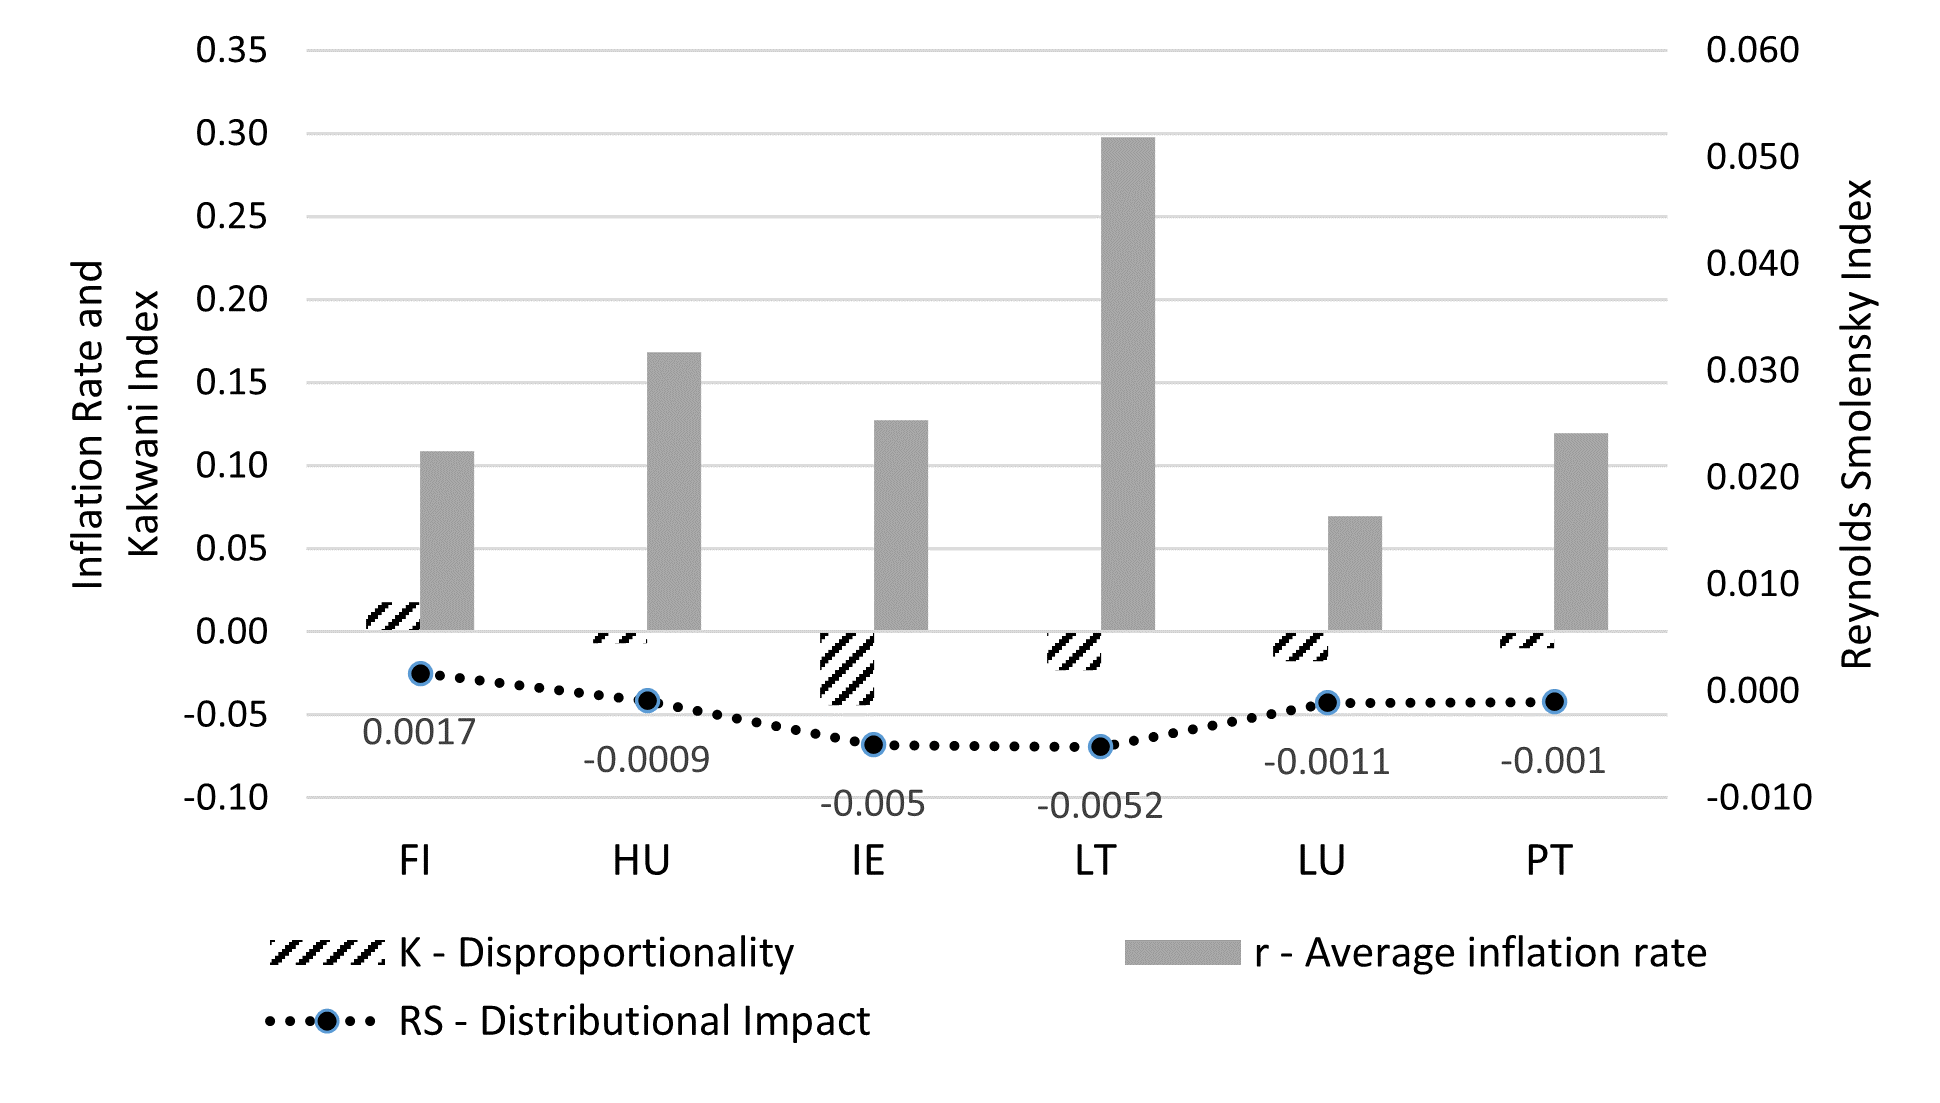
The Reynolds-Smolensky index (RS) confirms that inflation had a progressive impact (higher at the top) in Finland and a regressive impact in the other countries. The strongest regressive impacts are found in Lithuania and Ireland, followed by Luxembourg, Portugal and Hungary. These result from the interplay between the average inflation rate and the progression of inflation along the income distribution (or the disproportionality effect of price changes captured by the Kakwani index).
There is no “one size fits all” explanation. Similarly high levels of regressivity of inflation (Lithuania and Ireland) are driven by different levels of disproportionality and inflation rate: Lithuania records the highest average inflation, but has a moderate distributional impact due to a smaller disproportionality compared to Ireland, which has a much lower inflation rate. The same holds for Luxembourg, Hungary and Portugal: similar regressive impacts of inflation result from different driving factors.
Figure 7. Overall distributive effect, disproportionality and average inflation rate
Welfare losses of inflation
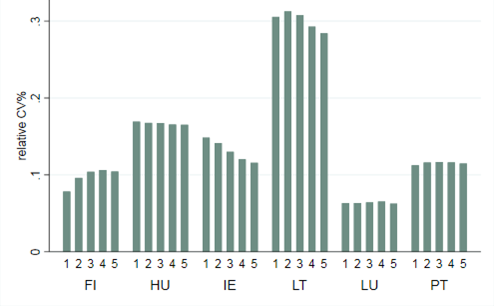
Figure 8 illustrates welfare losses measured by the compensating variation relative to total initial expenditure for households along quintiles of household equivalised disposable income. The compensating variation measures the monetary compensation that households should receive in order to maintain their initial well-being (utility) after the price increases. The welfare losses follow the same distributional pattern of inflation in Figure 6. The richer the country, the lower the welfare loss. In general, losses are greater at the bottom than at the top in Lithuania and Ireland, lower at the bottom than at the top in Finland and similar across quintiles in the other countries. The behavioural response has very limited effects on welfare in all six countries. This is expected given that the highest price changes are recorded for necessities (energy and food), leaving little space for household to adjust their consumption.
Figure 8. Relative changes in welfare measured by the compensating variation by equivalised disposable income quintile
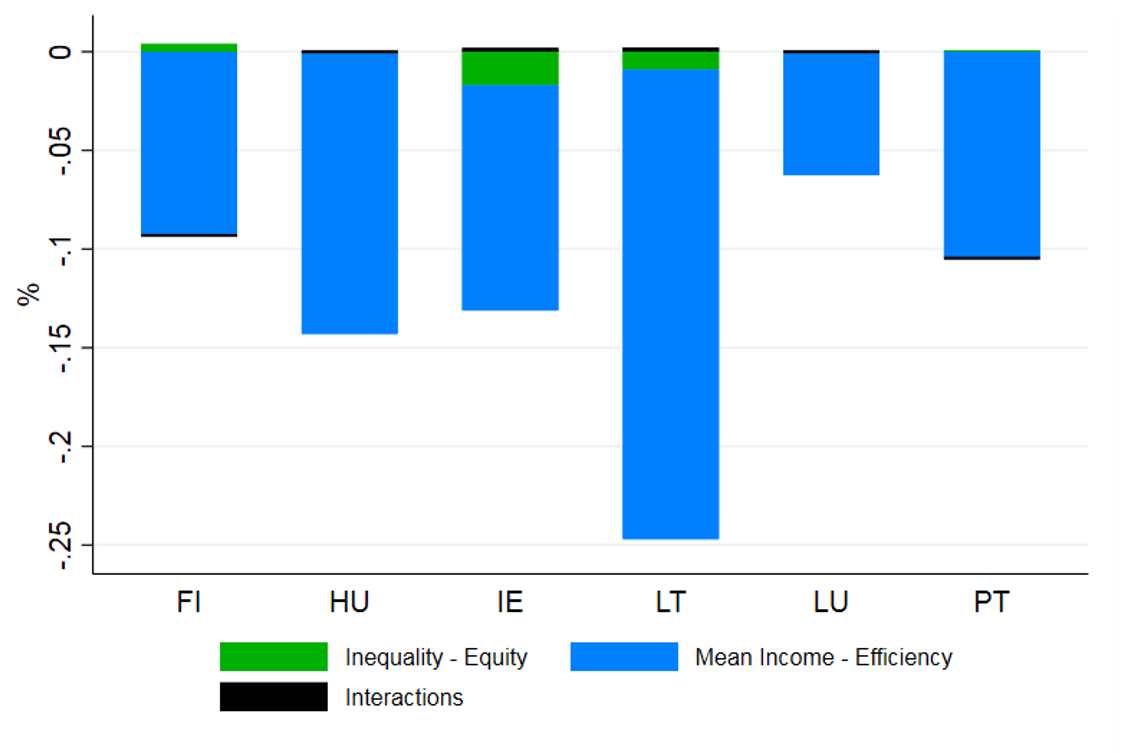
The welfare changes for the whole population are aggregated using the social welfare function associated with the equally distributed equivalent income. The decomposition of the welfare losses into their efficiency and equity components in Figure 9, reveal that the main driver of the welfare loss was the decrease in efficiency (decrease in mean equivalent income). The small changes in consumption inequality reveal that price increases affected all households, with a similar relative impact. In Ireland and Lithuania, the drop in welfare due to the increase on inequality was larger, consistent with the larger losses found for low-income households than for high-income households.
Figure 9. Decomposition of the welfare changes – drivers of welfare change: equity and efficiency
Key lessons
Budget shares for necessities such as food, domestic fuels and electricity are higher in poorer countries. Combined with a higher price growth in these necessities, this has resulted in higher inflation in poorer countries.
There is significant cross-country variability in the impact of inflation. Lithuania has the highest contribution toward inflation from food and fuels. Hungary is exceptional with the second highest food inflation, but the lowest fuel price inflation due to the price cap.
The most regressive inflation is found in Lithuania and Ireland. In Finland, inflation is progressive, driven by heating, motor fuels and other goods and services. The drivers of the regressive impact vary across countries: food and heating in Hungary; food, heating and electricity in Lithuania and Portugal; food, heating, electricity and motor fuels in Ireland and Luxembourg.
There is no “one size fits all” explanation: similar levels of regressivity of inflation can result from a different interplay between the level and the disproportionality of inflation along the income distribution. It would be useful in further work to consider the policy drivers of these differences, such as mitigation measures: for example, price caps on fuels, subsidies for services such as public transport, social transfers, technological changes to electricity production and trade policy decisions in relation to the sourcing of fossil fuels.
The change in social welfare is driven by the direct impact of price changes rather than the change in inequality, reflecting the relatively flat impact of the price changes. Overall, the behavioural component is relatively small due to the preponderance of necessities in the goods with the highest price changes.
Richer households have higher savings rates, with the bottom of the distribution having low or even negative savings rates. As a result, richer households can maintain expenditure levels by reducing savings or by tapping into accumulated savings. Poorer households have less capacity to absorb the price changes and therefore are more likely to have to reduce their expenditure volume than richer households.
Central Banks are responding to the inflationary environment by increasing interest rates. It is likely that these responses will affect households in different ways. The resulting lower expenditure and investment is likely to hit the middle of the distribution hardest, where many service sector and construction sector jobs are located. Higher interest rates on mortgages will increase housing costs, which will have a higher impact in the middle of the distribution, where savings rates are lower. Meanwhile the top of the distribution with higher capital incomes are likely to gain, while those with fixed incomes, and thus less able to manage exceptional price increases, at the bottom of the distribution will gain through a more stable price environment.
Looking back to recent crises (O’Donoghue et al., 2022), we know that a solidarity-focused policy response during the COVID-19 crisis protected living standards and enhanced trust in institutions in many countries. This was facilitated by lower interest rates from ECB. An austerity-focused response during the financial crisis saw the poorest lose and a reduced trust in government. With rising interest rates and cost of debt, the pressures during the current cost of living crisis is starting to look more like the financial crisis. There is a need therefore, to focus on maintaining living standards of the poorest and the squeezed middle, who as we saw during the financial crisis reduced expenditure when under financial strain with consequential public trust implications.
References
| Creedy, J. (2000). Measuring welfare changes and the excess burden of taxation. Bulletin of Economic Research, 52(1), pp. 1-47. |
| Pfähler, W. (1990). Redistributive effect of income taxation: Decomposing tax base and tax rates effects. Bulletin of Economic Research, 42(2), pp. 121-129. |
| O’Donoghue, C. (2021). Practical microsimulation modelling. Oxford: Oxford University Press. |
| O’Donoghue, C., Sologon, D., & Kyzyma, I. (2022). Novel welfare state responses in times of crises: the COVID-19 crisis versus the Great Recession. Socio-Economic Review, [mwac033]. https://doi.org/10.1093/ser/mwac033 |
| Sologon, D.M., C. O’Donoghue, J. Linden, I. Kyzyma, J. Loughrey. (2022). Welfare and Distributional Impact of Soaring Prices in Europe, IZA DP No. 15738 |