Issue, No.23 (September 2022)
Income Growth in Peru: who is on Board and who is Left Behind?
In their recent LIS working paper (Guaitoli and Pancrazi, 2022) and the follow-up LIS Inequality Matters article, the authors observed different trends in intergenerational income inequality in high-income, transition and developing economies. Developing countries experienced decreasing intergenerational inequalities, with the disposable income of individuals at the beginning of their careers catching up or overtaking the income of individuals at the end of their careers. Uneven expansion of education may explain eroding intergenerational inequalities in some of these countries: young people are the first to benefit from increased schooling and secure better-paid jobs in the medium run. However, the effects of rapid income growth and structural changes in the economy on different age cohorts are far less clear when individual countries are concerned. In particular, the development of incomes of elderly individuals depends on the interplay of factors such as informality in the labour market, public transfers and an often-overlooked factor of household composition.
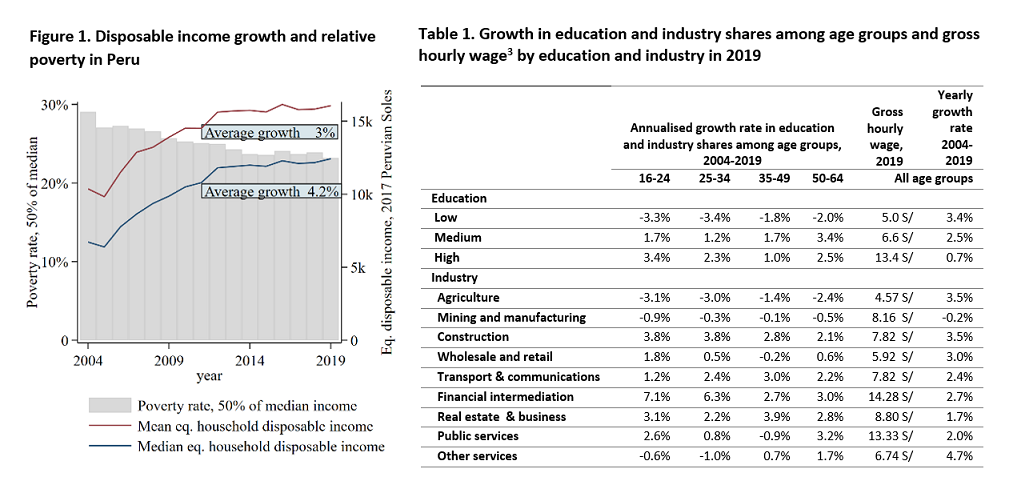
In this article, we examine trends in intergenerational inequalities in disposable income in Peru using newly available annual data in the LIS database from 2004 to 2019. Peru is one of the developing countries experiencing rapid structural changes, and a country with one of the largest informal sectors among Latin America and the Caribbean countries (OECD, 2016). Before the 2020 pandemic, Peru had positive real GDP growth, averaging 4% per year between 2004 and 2019 (World Bank1). In the same period, average household disposable income (accounted for household size using the LIS equivalence scale2) grew by 3%, and the median income grew by 4.2% annually (Figure 1). As Figure 1 and LIS Key Figures suggest, income growth in Peru in the period of 2004 to 2019 contributed favourably to reducing overall inequality and poverty in the country.
Concerning the working age population, disposable income grew faster than average among individuals under 35 years of age, and a bit slower among those between 35 and 64 years (Table 2). Structural changes in education and industry in the period of 2004 to 2019 do not provide a clear explanation for the observed trends, yet they suggest that some of the highest-paying industries may be favouring younger workers (Table 1). Concerning education, there have been larger increases in tertiary education attainment (2.3-3.4% annually) compared to upper secondary and post-secondary education (less than 2% annually) among individuals below 35 years of age. The reverse was true for older individuals, who saw the largest increases in upper secondary education. While individuals with tertiary education were receiving twice as much in hourly wages (13.4 Peruvian Soles in 2019) than individuals with upper secondary education (6.6 Peruvian Soles), average wages grew fastest among the least educated (3.4% annually compared to 0.7-2.5% among the more educated). Concerning industry, employment in agriculture as well as mining and manufacturing sectors declined between 2004 and 2019 among all age groups. On the other hand, employment in various service sub-sectors did not grow uniformly. For example, the largest paying sector of financial intermediation employed mostly individuals at the beginning of their careers (16 to 34 years of age). Despite the differences in remuneration across industries, average wages in the main employment grew in all sectors apart from the mining and manufacturing sectors, with the highest increases in agriculture (3.5%), construction (3.5%), and other services (4.7%) annually.
Source: Luxembourg Income Study (LIS) Database.
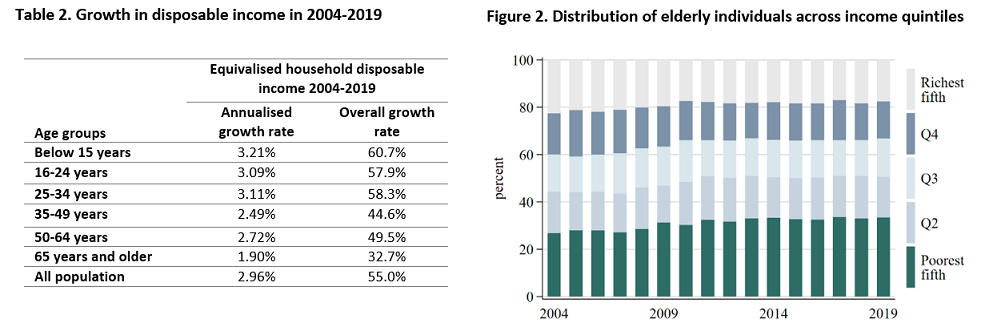
For people over 65 years of age, income growth was the lowest among age groups, averaging 1.9% per year compared to 3% in the overall population. According to the LIS Key Figures, the relative poverty rate remained stable or increased slightly among the elderly in the same period. However, individuals over 65 years of age were increasingly more likely to appear among the poorest 20% of the country’s population (Figure 2). Between 2004 and 2019, the share of elderly individuals belonging to the poorest fifth of the disposable income distribution rose from 27% to 33%.
Source: Luxembourg Income Study (LIS) Database.
There are two main reasons why the elderly may stay disproportionately represented among the poorest fifth of the population in the medium run. First, work activity in the informal sector remains high in Peru. According to the LIS data, among those dependent employed, self-employed or contributing to family work, 60.4% worked in the informal sector in 20194. Other sources reported the size of the informal sector of 72.8% of total employment in 2014, one of the highest in Latin America and the Caribbean countries (OECD, 2016). Moreover, according to the report, informal labour was particularly high among workers aged 65 or older and among individuals residing in households most vulnerable to poverty. Having a large informal sector means that many people are not entitled to social security in old age. As a result, elderly individuals tend to rely on labour income more than on pension income (Table 3). We find an increase in labour market activity among the elderly between 2004 and 2019 but no increase in the share receiving public contributory pensions. To combat poverty among the elderly in Peru, a social assistance pension (Pension 65) was rolled out in 2011, which serves elderly individuals in extreme poverty who are not eligible for the public contributory pension. However, as Table 3 suggests, the adequacy of social assistance pensions remains low compared to contributory pensions. In addition to this, public contributory and assistance pensions combined reached less than half of the elderly population in Peru in 2019, 26.1% received contributory pensions and 21.1% social assistance pensions.
Source: Luxembourg Income Study (LIS) Database.
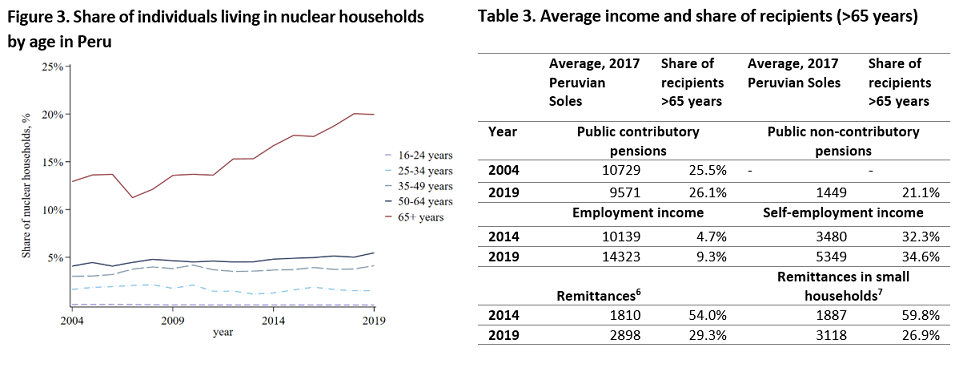
Second, an often-overlooked factor is the changes in household composition. This affects not only the sharing of income among relatives but also the conditions in which people live. Figure 3 shows that the elderly are increasingly more likely to live alone or with their spouse without extended family members. In addition to this, the share of the population over 65 years of age living in households receiving some form of remittances has nearly halved in 2004-2019 (Table 3). The same trend holds for the elderly living alone or with their spouse. This means that retired individuals in Peru not only lack adequate social security in old age but also are less able to rely on income from extended family members. These trends are concerning: for example, Olivera & Clausen (2014) previously found that the most vulnerable individuals over 65 years of age in Peru resided in households with one or two members5.
To sum up, a glimpse at the annual Peru data for the years 2004 to 2019 shows that income growth has decreased overall poverty and inequality, but amplified intergenerational disposable income inequalities. Working-age individuals at the beginning of their careers had larger increases in disposable income compared to individuals at the end of their careers. Structural changes in education and sector employment might have contributed to these changes but not in obvious ways. On the other hand, people over 65 years of age were not participating equally in income growth, and some of them were more likely to live in small households and without social insurance transfers. In addition to this, the cohort of individuals between 50 and 64 years who are currently benefitting from income growth is likely to face the same issues as the current cohort of elderly individuals while the informal sector remains large and the dependence on family networks is eroding. In the medium run, a pension reform might ensure that the elderly in Peru are not entirely left behind during times of sustained economic growth.
1 World Bank. GDP per capita, PPP (constant 2017 international $)” World Development Indicators. The World Bank Group, 2022, https://data.worldbank.org/indicator/NY.GDP.PCAP.PP.KD. Accessed 10 Sep. 2022.
2 Square root of the number of household members.
3 Gross hourly wage in main occupation, LIS variable gross1.
4 LIS variable informal flags individuals who reported not having an employment contract.
5 The findings referred to year 2011, before the introduction of social assistance pensions.
6 Remittances were available at the household level only and were accounted for household size using the LIS equivalence scale.
7 Defined as households comprising of only the head and spouse.
References
| Guaitoli, G., & Pancrazi, R. (2022). Global Trends in Intergenerational Income Inequality? LIS Working Paper Series, No. 828. |
| Olivera, J., & Clausen, J. (2014). Las características del adulto mayor peruano y las políticas de protección social. Economía, 37(73), 75-113. |
| OECD (2016). Multi-dimensional Review of Peru: Volume 2. In-depth Analysis and Recommendations, OECD Development Pathways, OECD Publishing, Paris, https://doi.org/10.1787/9789264264670-en |