Issue, No.22 (June 2022)
Global Trends in Intergenerational Income Inequality?
Introduction: current issues of intergenerational income inequality
Readers of this newsletter are probably aware that the increase in income differences between young and old, so-called intergenerational income inequalities, has recently risen to prominence in ’the political and media debates of many countries. For example, policy-makers such as the House of Lords in the UK or the European Commission in the EU have produced in-depth reports regarding intergenerational inequality (House of Lords, 2019; Raitano et al., 2021). At the same time, more and more institutions have begun studying and documenting this issue for specific countries (e.g. Masson (2021) for France, Barra et al. (2021) for Ireland, Berry and Sinclair (2010), Miller et al. (2020) for Australia, and Henehan et al. (2021) for the UK).
Although intergenerational inequalities generate understandable concerns, many dimensions of this phenomenon are still not well-understood or are under-investigated. For example:
- There are no objective measures of intergenerational income inequality that allow assessing the magnitude of the phenomenon in different countries in a comparable, meaningful way.
- It is unclear whether different countries share similar trends as regards the evolution of intergenerational income inequality.
- Because most previous studies focus solely on labour income, the role of other dimensions of income, such as employment shares, transfers, or taxes, on intergenerational income inequality remains unknown.
- Consequently, the available analyses do not thoroughly investigate the likely economic drivers of the global phenomenon.
This short article discusses how the paper entitled “Global Trends in Intergenerational Income Inequality?” addresses these shortcomings by conducting a global, coherent, and in-depth analysis of intergenerational income inequality. By extensively leveraging the international individual income microdata harmonised and made available by LIS, the paper studies how intergenerational inequalities have evolved over the last 20 to 30 years across 42 countries, grouped into Rich countries, Transition economies, and Developing economies. Therefore, the analysis exploits both the time-series and cross-section dimensions of the microdata available from LIS. Such analysis provides evidence of the recent differences and similarities in intergenerational income inequality trends for several countries at different stages of economic development. Finally, the dataset and the proposed inequality measures permit a detailed decomposition of the role of the sub-components of income in the evolution of intergenerational income inequality.
Stylised Facts on Global Intergenerational Income Inequality
Two measures of intergenerational income inequality are introduced in the article.
The first one is the Intergenerational Income Ratio, IGIR. With a simple number, it captures the relative average disposable income of two age groups in any given year. Since an age group includes all individuals of that age, regardless of employment status, this measure provides a broad picture of overall income inequalities between generations. This measure, which differs from comparing the changes in income of a given cohort at different points in time, has two advantages. First, it highlights how economic resources are distributed, in a given period, among different segments of the population related to their age. This is a relevant perspective because it not only relates to other important dimensions of wellbeing and intergenerational fairness, such as housing, political representation, and lobbying power over fiscal policies, but might also be a symptom of profound structural transformations in the economy. Second, this approach, together with the data available, allows relating intergenerational income inequality to long-term economic trends.
Figure 1 displays the evolution of the IGIR between individuals aged 50-64 and individuals aged 25-34. We choose these two age groups because they reflect individuals that have already completed their education and are at opposite ends of their career paths, having recently started (25-34) or getting closer to retirement (50-64). The simple average IGIR of each sub-group of countries is displayed: solid blue for Rich countries, dashed red for Transition economies, and dotted black for Developing countries. Notice that, in Rich countries, the young were earning more than the old in the early 1990s. In contrast, by 2010 the old were earning more than the young in those same countries. The IGIR upward trend appears to have continued in the last decade for most Rich countries, with very few exceptions. On the other hand, most lower-income countries experienced a stationary or downward-trending IGIR, as shown by the Transition and Developing economies time series.
Figure 1: IGIR, 50-64 vs 25-34 years old
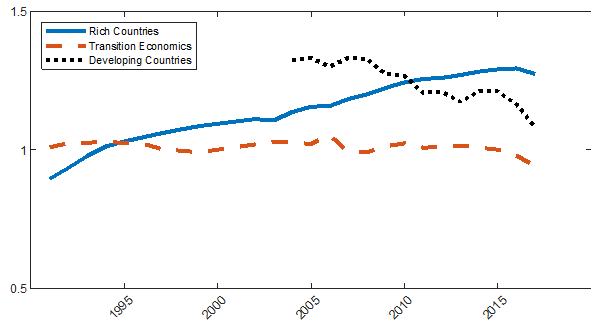
Source: Guaitoli and Pancrazi (2022) based on Luxembourg Income Study (LIS) Database.
This evidence leads to a first stylised fact: the intergenerational income ratio has steadily risen in the last 25 years by around 30 percent in Rich countries, while it has been constant and around one in the Transition economies. Finally, this ratio has declined since at least 2005 in Developing economies, although it was a larger ratio to begin with.
The second measure introduced in the article is the Growth Rate Differentials, GRD. It measures the gap in income growth rates between two different age groups, capturing – regardless of the initial level – whether the average income of the old has been increasing faster than that of the young. The GRD directly relates to the temporal evolution of the IGIR, and it can be easily decomposed to quantify the role played by individual income components, (such as changes in labour remuneration, employment rate, transfers, or taxes) in shaping the trends of intergenerational income inequalities.
As a preliminary step, one might wonder how disposable income has grown for each age group in the last two decades. Table 1 summarises the average income growth by geographical region for each age group. In Southern Europe, the income of the 25-34 category fell by an average of 2.3 percentage points per year; in the rest of Western Europe, it increased by a tiny 0.3 annualised percentage points. The figures are even smaller for the 16-24 age group, which experienced negative average income growth everywhere in Western Europe except in the UK (where it is only slightly positive). In contrast, Developing economies show – in a context in which the average income of all age groups is increasing at sustained rates – a faster increase in income for younger individuals.
Table 1: Mean Income Growth (annualised percentage points), by age and region
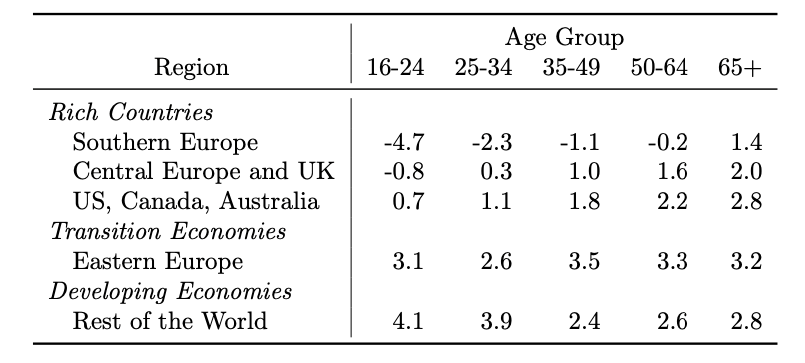
Note: Geographical regions are as follows: Southern Europe: Greece, Italy, Spain; Central Europe and UK: Austria, Belgium, Denmark, Finland, Germany, Ireland, Switzerland, Netherlands, Norway, UK. Eastern Europe: Czech Republic, Estonia, Hungary, Poland, Slovakia, Slovenia. Rest of the World: Brazil, Chile, Colombia, Mexico, Paraguay, Peru, Uruguay, India. Means are across countries, with equal weight given to each country.
The GRD, defined as the difference between the income growth rate for the old (50-64) and the young (25-34), captures this dichotomy between Rich and Developing countries very neatly. They are displayed in panel (a) of Figure 2. Consistent with the finding in Figure 1, the GRD are positive for all Rich countries, reaching a maximum of 4 percentage points, per year, in Spain and Ireland. At the same time, they are negative for most Developing economies. Transition economies show mixed results. Panel (b) sheds light on the specific growth rates of the young and the old. This figure confirms that the positive GRD in Rich countries are driven by stagnant income growth for the young and positive and greater income growth for the old. The striking difference in income growth favouring the old is not present in Transition and Developing economies.
This evidence leads to a second stylised fact: growth rate differentials are positive for all Rich countries, where the income of the young did not grow, while that of the old increased substantially; instead, growth rate differentials are negative for most lower-income countries, where the income of both young and old grew at fast rates, but more so for the young.
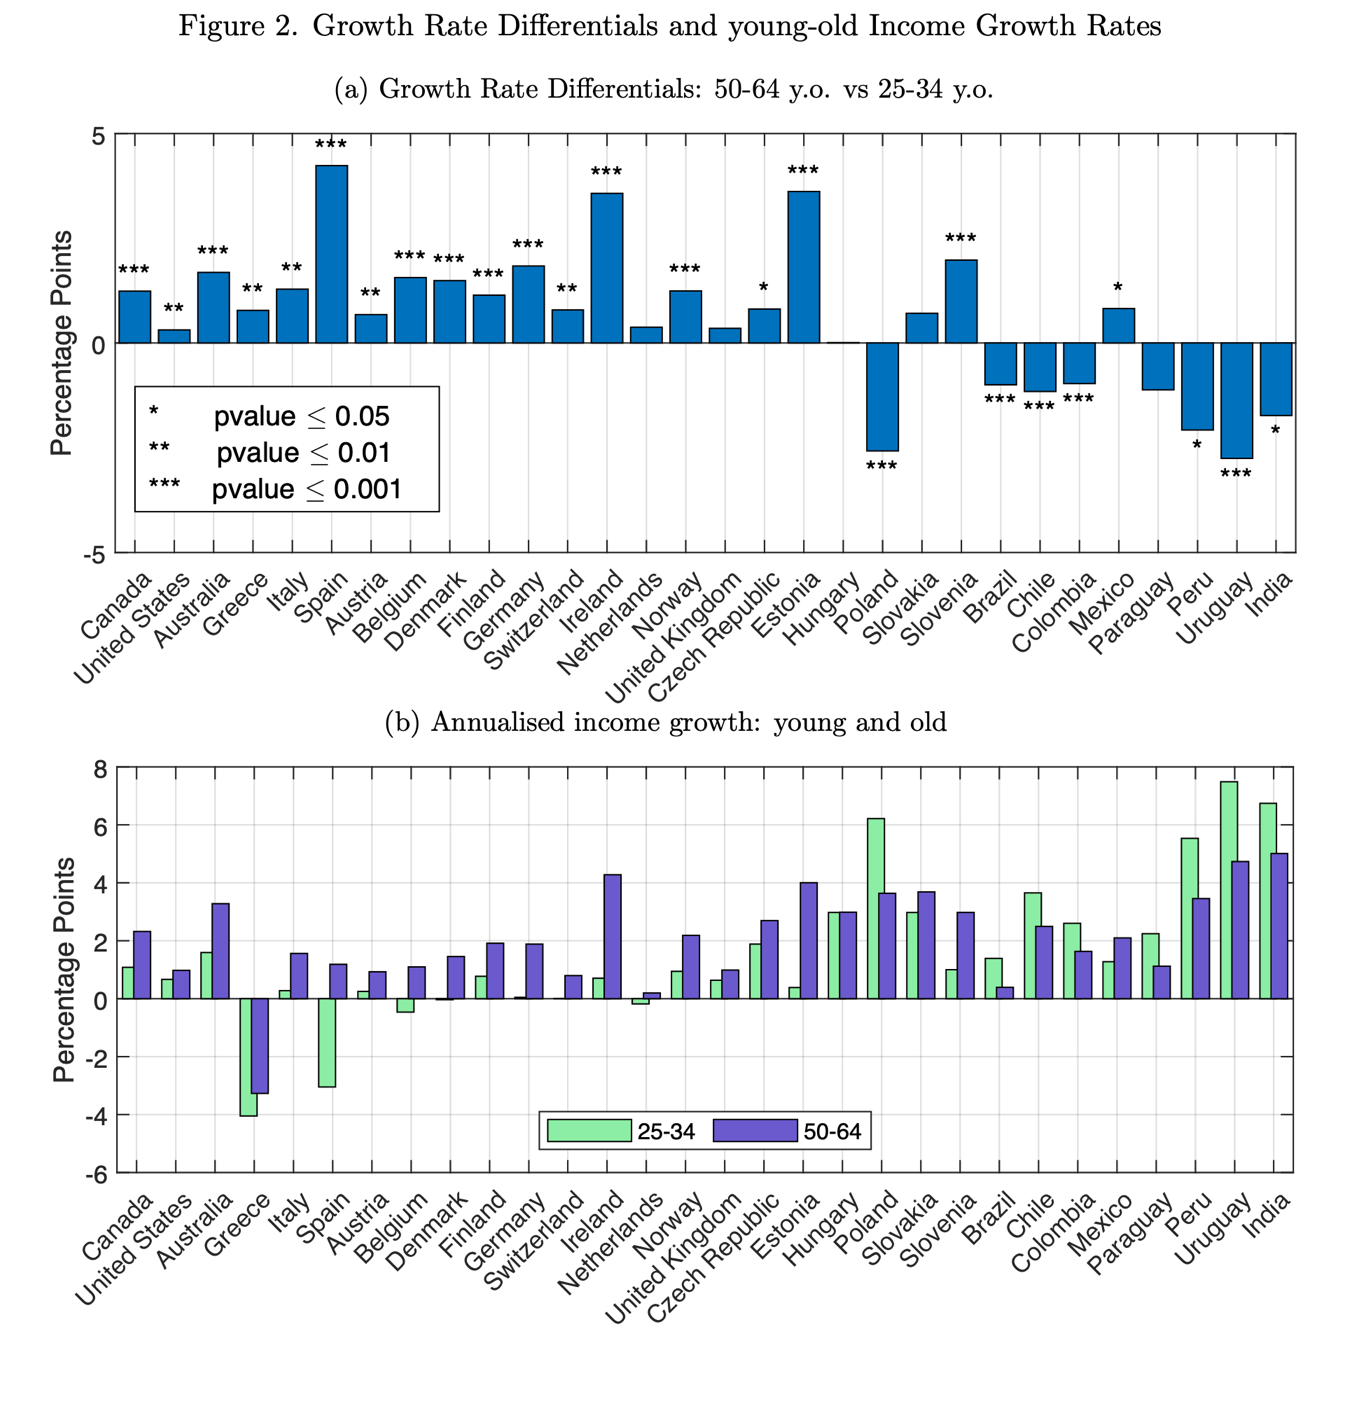
Note: Panel (a) displays the annualised disposable income Growth Rate Differential (GRD), comparing 50-64 years old individuals with 25-34 years old ones. A positive value indicates that the income of the old has increased faster than the one of the young over the reference periods. We report statistical significance with respect to the null hypothesis GRDi = 0. Panel (b) reports the underlying growth rates of net income used to calculate GRD.
Discussion: Channels at play and policy implications
These results point toward two facts that researchers and policy-makers should consider in the future. First, intergenerational inequalities also need to be understood from an international perspective. Models attempting to explain intergenerational inequality and proposing policies for alleviating it need to consider how this phenomenon also strongly correlates with the current level of development of a country. Understanding the causes of this correlation is essential for designing welfare and tax schemes for current and future generations. Second, this phenomenon is potentially worrisome because more considerable differences in income between young and old may foster other dimensions of inequalities, poverty, and deprivation, including the transmission of inequalities across generations, as well as having detrimental effects on the concept of intergenerational “fairness” and solidarity at the basis of the welfare state.
The article proposes two possible explanations for the observed stylised facts. It highlights how changes in the differentials in educational achievement and employment in high-skilled occupations between young and old are strongly connected to the changes in income intergenerational inequalities, although in non-obvious ways. In high-income countries, old individuals are catching up with younger ones in educational achievement. This means that the average young individual now holds a lower “skill advantage” over the average old one, and thus faces more competition on the labour market. In fact, share shift in educational achievement can explain half of the rise in intergenerational income inequalities between 1997 and 2019 in Rich countries. In contrast, young workers in Developing countries are facing almost the opposite scenario: they are the ones moving into new services and tech jobs, and out of agriculture and unskilled manual labour, meaning that they are the ones benefitting the most from (and potentially causing) the rapid income growth in their countries. This phenomenon explains 40 percent of the average fall in intergenerational inequalities in such countries.
The rise in intergenerational income inequalities in high-income countries is, at least in part, a natural consequence of long-term trends in economic development. Similarly, the fall (or stability) in lower-income countries appears to be a transitory phenomenon led by rapid transformations of the economy, with the current young generations strongly benefitting from higher education levels and structural/technical change. Nevertheless, local policies and economic factors are still likely to explain the residual part of these trends and influence both education and training.
These results suggest that the upward trends in intergenerational income inequality in high-income countries have been the effect of decades-long transition dynamics. Nevertheless, they also suggest that tackling intergenerational inequalities may indeed need public policies. Governments should consider whether their current welfare state and tax schemes are still compatible with intergenerational fairness, in light of these long-term trends and projected growth rates. It seems, in fact, implausible that we will see a reduction in intergenerational inequalities in Rich countries without some form of policy intervention.
References
| Afman, E. (2020). “Income, Wealth and Intergenerational Inequality in the Netherlands,” European Economy – Economic Briefs 053, Directorate General Economic and Financial Affairs (DG ECFIN), European Commission. |
| Barra, R.; Maˆıtre, B.; McTague, A.; Privalko, I. (2021). “Intergenerational inequality: Chapter 4 in Poverty, Income Inequality and Living Standards in Ireland,” Book/report chapter 202104, ESRI and The Community Foundation for Ireland. |
| Berry, C. and Sinclair, D. (2010). “Intergenerational Fairness and the Spending Review 2010,” Report, The International Longevity Centre – UK. |
| Cribb, J. (2019). “Intergenerational Differences in Income and Wealth: Evidence from Britain,” Fiscal Studies, 40, 275–299. |
| Guaitoli, G. and Pancrazi, R. (2022). “Global Trends in Intergenerational Income Inequality?”, LIS Working Paper Series, No.828. |
| Guvenen, F.; Kaplan, G.; Song, J.; Weidner, J. (2022). “Lifetime Incomes in the United States over Six Decades,” The American Economic Review: Applied Economics, Forthcoming. |
| Henehan, K.; Gustafsson, M.; Cominetti, N.; Handscomb, K.; Judge, L.; Leslie, J.; Try, L. (2021). “An intergenerational audit for the UK: 2021,” Report, London: Resolution Foundation. |
| House of Lords (2019). “Select Committee on Intergenerational Fairness and Provi- sion: Tackling intergenerational unfairness,” https://publications.parliament.uk/pa/ld201719/ldselect/ldintfair/329/329.pdf. |
| Masson, A. (2021). “Intergenerational economic inequality in France. Insights and perspec- tive,” Futuribles, 441, 25–34. |
| Miller, H.; Meyricke, R.; Dixie, L. (2020). “Mind the gap: the Australian Actuaries Intergenerational Equity Index-green paper,” . |
| Raitano, M.; Karagiannaki, E.; Premrov, T.; Geyer, L.; Fuchs, M.; Bloise, F.; Costa-Font, J.; Iudicone, F.; De Micheli, B. (2021). “Study on intergenerational fairness: final report,” Brussels: European commission. |