Issue, No.21 (March 2022)
Investigating Inclusive Income Growth with LIS Data
Rising income inequality across high-income countries in recent decades has prompted more calls among scholars, policymakers, and the general public for more inclusive income growth. However, understanding what influences the inclusivity of income growth for a given country has long been a challenging task. As such, scholars have offered different perspectives on the role of changes in taxes, transfers, composition (such as changes to family structure, educational attainment, or employment), or other factors as the most influential factors affecting inclusive income growth.
In a new study, published in the American Sociological Review, we attempt to adjudicate these different perspectives and identify the levels and sources of inclusive income growth across eight high-income countries from the 1980s to 2010s. These countries include the United States, Australia, Canada, Germany, France, the Netherlands, Denmark, and Finland. In our study, we introduce a methodological framework that allows us to measure the additive contribution of changes in taxes, transfers, composition, and other factors including market institutions in shaping income growth at each point along an income distribution. We call these “growth profiles,” and our evidence suggests that the eight countries we study featured vastly different growth profiles throughout recent decades. Specifically, our findings point to four key takeaways regarding inclusive income growth, which we elaborate on in turn.
First, we find that the most egalitarian countries have generally seen the largest increases in inequality in recent decades. Figure 1 shows each country’s income distribution in the 1980s compared to the 2010s. In the lower-right corner of each panel is the change in the country’s P90/P10 ratio (one measure of inequality) during the two time points. The descriptive findings show that Finland experienced a greater increase in the P90/P10 ratio from the 1980s to 2010s than did the United States, Canada, or Australia. To be sure, Finland still features much lower levels of inequality compared to these countries and smaller absolute increases in inequality. Nonetheless, these changes in inequality throughout the past three decades justify greater investigation of trends in inequality as a complement to investigations of long-standing variation in levels of inequality.
Figure 1. Levels of Disposable Income (Thousands of PPPs) by Percentile in 1980s and 2010s and Changes in 90th Percentile Relative to 10th Percentile (P90/P10 Ratio)
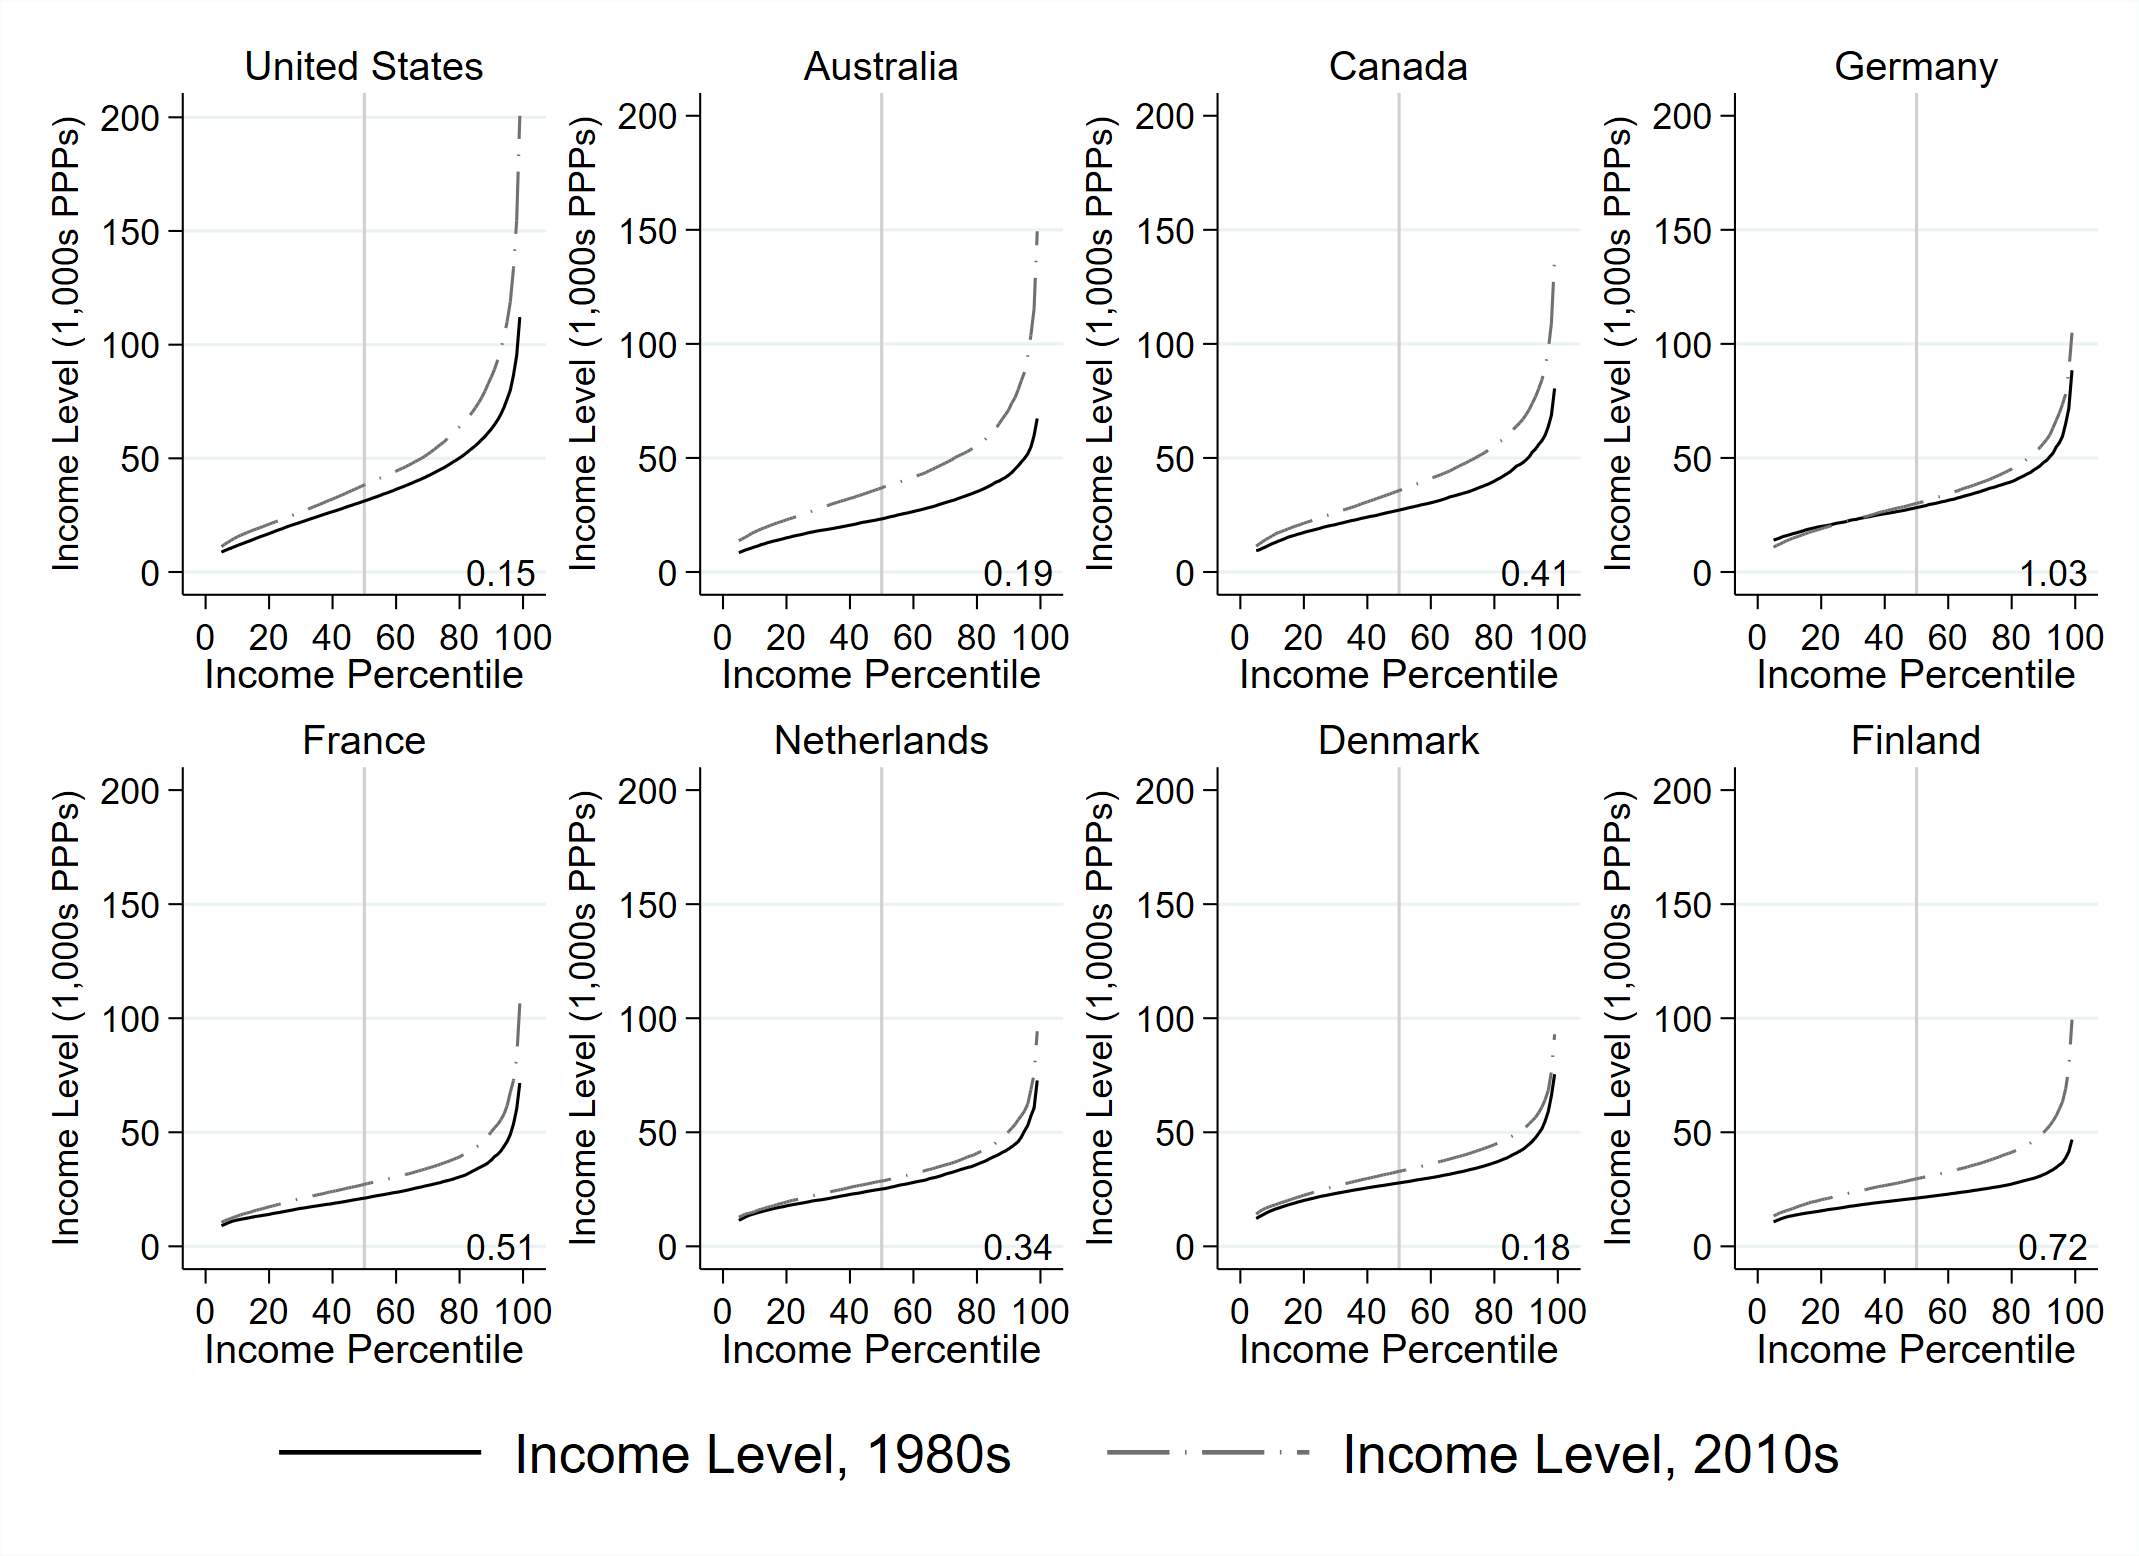
Note:Number in bottom-right of each panel represents the difference in P90/P10 ratio for each country from the first to the final year (the final year’s P90/P10 ratio minus the first year’s ratio).
Source: Luxembourg Income Study (LIS) Database.
What factors led to Finland seeing the strongest rise in income inequality among these countries and time periods observed? More generally, how do countries vary in the levels and sources of income growth? We apply our national growth profiles to help answer these questions.
This leads to our second finding: changes to taxes and transfers have been an essential component of inclusive income growth in all of our study countries. It is well-known that, from a cross-sectional perspective, taxes and transfers play an important role in reducing inequality. Our findings reveal that policy-driven changes in taxes and transfers are often essential toward promoting inclusive income growth. Specifically, we find that policy-driven changes in income transfers were the strongest individual contributors to income growth at the 10th percentile in each country. We emphasize policy-driven changes above, as our decomposition framework allows us to evaluate the changes in the amount of taxes paid or transfers received due to changes in policy rules, rather than compositional changes (such as differences in employment or family structure over time) that affect the amounts of transfers paid or taxes received.
Figure 2 documents the contribution of policy-driven changes to transfers to income growth across the distribution in each country (the black circles). The gray triangles depict how compositional changes – such as higher or lower employment rates across time – influence changes in the level of transfers provided to a certain part of the income distribution.
Figure 2. Contribution of Transfers to Disposable Income Growth
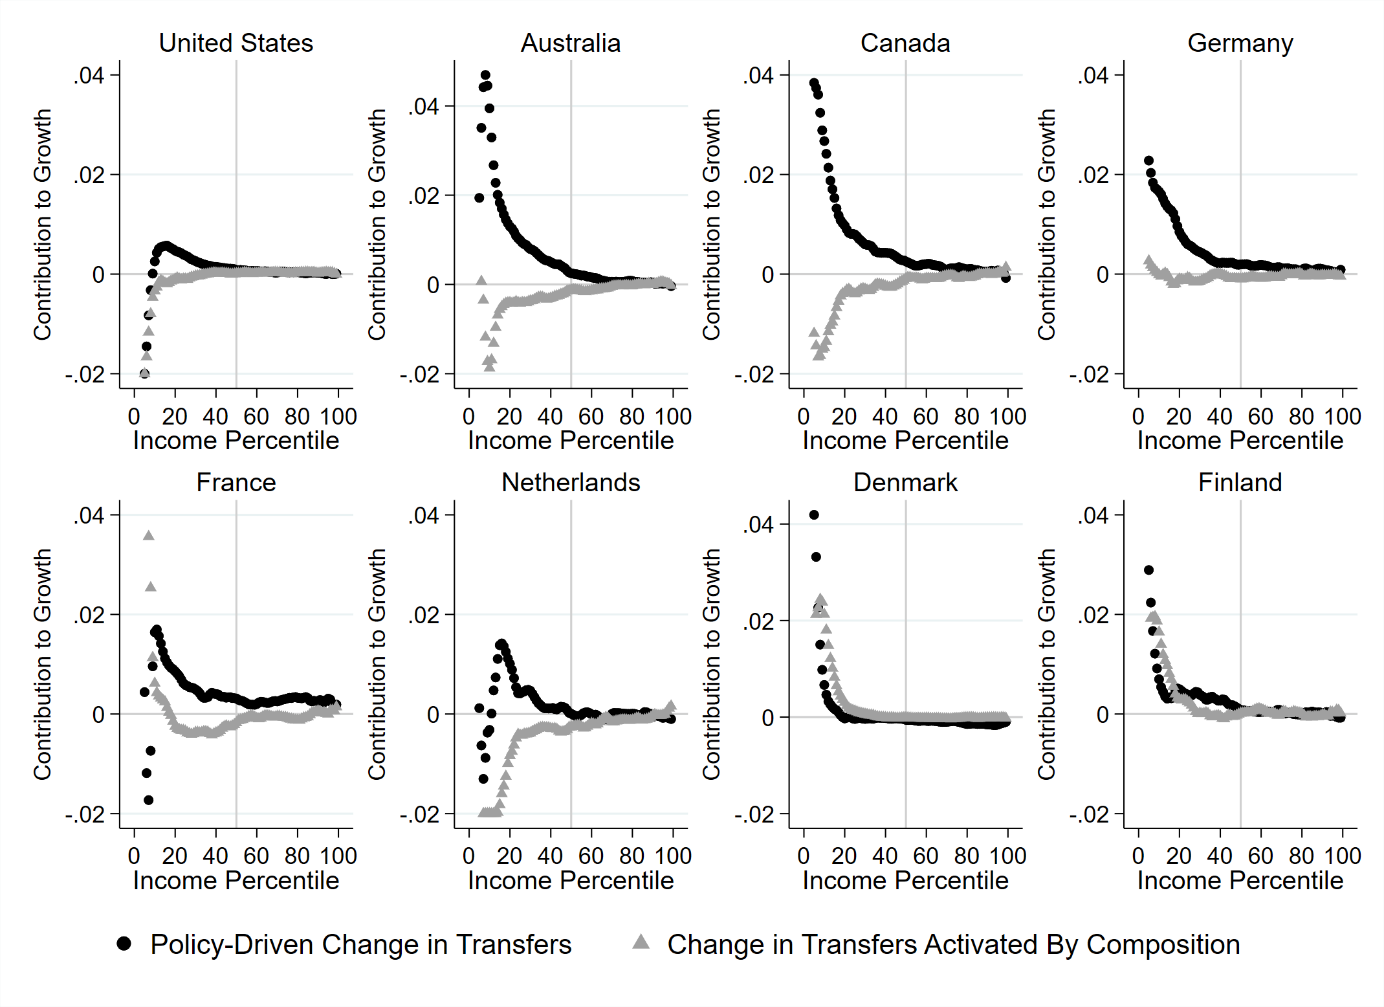
Note:Income growth is measured as cumulative relative income growth divided by the number of years between the earliest and latest data points for the country.
Source: Luxembourg Income Study (LIS) Database.
In nearly all of our study countries, policy-driven changes in transfers played an important role in driving income growth in the bottom 20 percentiles of the income distribution. In Australia and Canada, for example, changes to income transfer programs contributed to income growth around the 10th percentile of an average of 4 percent per year. Across all countries, changes to income transfers played a much smaller role in shaping income growth near the top of the distribution. This is expected, given that income transfers play a limited role at the top of income distributions.
Policy-driven changes to taxes, meanwhile, do play an important role in limiting income growth at the very top of the distribution. Figure 3 visualizes this. As before, the black dots represent the contribution of policy changes to taxes in shaping income growth. In the Netherlands and Denmark, for example, policy-driven changes in taxation that reduced incomes near the top of the distribution, were essential for achieving more inclusive growth. Tax policy changes in the United States, Australia, and Finland, meanwhile, increased top incomes and contributed to less inclusive growth.
Figure 3. Contribution of Taxes to Disposable Income Growth
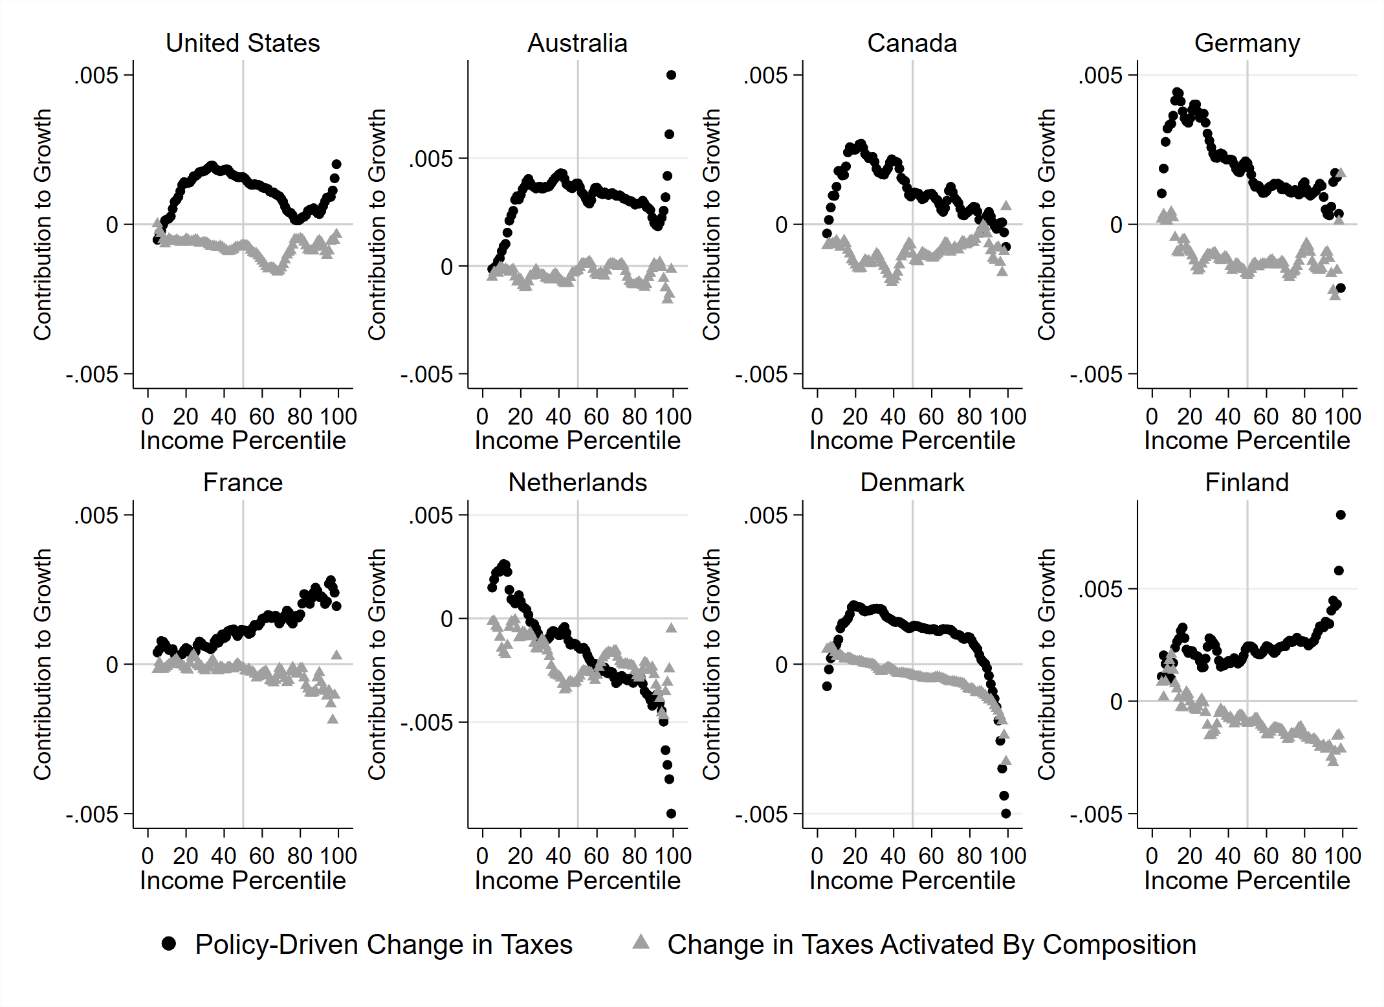
Note:Income growth is measured as cumulative relative income growth divided by the number of years between the earliest and latest data points for the country.
Source: Luxembourg Income Study (LIS) Database.
More broadly, our results suggest that changes to tax and transfer systems have been more consequential than compositional change in influencing inequality – but, according to our findings, primarily at the tails of the distribution.
Third, we find that rising educational attainment had the largest effects on changes in incomes across most of each country’s distribution. In fact, when changes in education are accounted for, changes in assortative mating, single parenthood, and other family structure effects have little consequence for changes in a country’s income distributions. Notably, though, rising educational attainment does not often promote more inclusive income growth; instead, its contributions to income growth are concentrated among the top half of the income distribution. These findings suggest that promoting more educational attainment alone is insufficient to achieve inclusive income growth.
Fourth, and last, our findings suggest that changes in other factors including market institutions have generally promoted non-inclusive income growth, but with large variation by country. These ‘other factors’ include everything from changes in wage-setting institutions (such as changes to minimum wages or the strength or organized labor) to the influence of unmeasured characteristics in our models. In the United States, the non-inclusive effect of other factors, particularly at the top of the income distribution, is consistent with skill-biased technological change perspectives of rising returns to educational attainment. In countries that have generally maintained high levels of union membership and collective bargaining coverage, such as France, changes in other factors did not contribute to similar increases in inequality. We find, for example, that if the United States or Finland had experienced the same effect of changes in other factors as France, they both would have seen much lower income growth at the very top of their distributions. Similarly, our results suggest countries such as the United States and Finland could have adopted the tax policy changes of the Dutch, the transfer policy changes of the Danish, or followed a number of other pathways to achieve more inclusive income growth than observed.
In sum, the use of national growth profiles to evaluate levels and sources of inclusive income growth helps to shift focus from historical variation in inequality across political-institutional context to the mechanisms underlying ongoing changes in income inequality across high-income countries. Moving forward, scholars across sociology, social policy, and economics disciplines can apply national growth profiles and our decomposition framework to a wide array of investigations into inequality or income growth using LIS data. As our study demonstrates, national growth profiles provide conceptual and empirical advantages in understanding the varying sources of rising income inequality across high-income countries.
References
| Parolin Z. and Gornick J. C. (2021). Pathways toward Inclusive Income Growth: A Comparative Decomposition of National Growth Profiles, American Sociological Review, Vol. 86 (6), pp.1131-1163, https://doi.org/10.1177/00031224211054808. |