Issue, No.17 (March 2021)
Inequality Reduction in four Advanced Countries from 2000 to the late 2010s
In recent years, advanced societies have been showing inequality increasing trends. As shown by Causa and Hermansen (2018) social transfers are an important source of income support particularly among low-income households, but the authors emphasized that total cash support has declined from 2000 to the mid 2010s. Thus, in this brief, we take a closer look at the changes in the income distribution over this period. For this study, we select four countries from the Luxembourg Income Study (LIS) Database that have mostly annual data for the period 2000 to 2018. As of March 2021, the British data became available in an annual series, German and the U.S. data were already annualised before, and the Canadian series contains annual data starting from 2012.
This article is structured as follows. First, we present an overview of Gini Index trends, calculated based on three different definitions: market income, gross income, and disposable income. We hence analyse by how much inequality has been reduced from market income to disposable income and how this pattern has changed over-time. In a next section, we look at how incomes have developed at the bottom, at the median, and at the top of the income distribution. In a last section, we focus on the effect of the tax system in inequality reduction for the year 2016. The conclusion seeks to give advice for further studies analysing redistribution.
Inequality of what? This seems a rather simple question, but the answers are manifold. Related to human well-being, the literature focuses mostly on two dimensions, first ‘inequality of outcomes’ (such as the level of income or educational attainment) and second ‘inequality of opportunities’ (such as unequal access to employment or education) (UNDP, 2013). Here, we focus on income, but various other angles such as wealth, material well-being, or social exclusion ought to be considered if one wanted to get a broader understanding about human well-being in a cross-national perspective. In this article, we take the position that redistribution through state efforts is a crucial pillar for reducing inequality. Two major pathways of social redistribution exist; one is the collection of social contributions and taxes (in progressive tax systems, average tax rates increase with income, and hence reduce inequality), the second is the allocation of benefits, which is mostly in favour of low-income households.
Thus, in the following, the question ‘inequality of what’ is answered by ‘inequality of income’. We apply three definitions of income to show the impact of two stages of redistribution (Figure 1). First, we take a look at market income, here defined as labour income plus capital income plus contributory pensions, and plus private transfers. This approach considers contributory state pensions, as well as any private pensions, as intertemporal deferred wage, hence part of market income rather than social redistribution. Our second definition, gross income, adds transfers received by the state. Thus, the distance between the line market income and gross income is in the following labelled social transfers redistribution. Finally, a last definition looks at disposable income, which deducts social contributions and income taxes from gross income. The distance between gross income and disposable income is in the following labelled tax redistribution.
Figure 1 exemplifies well that redistribution works rather differently in the four countries, with the US showing clearly the least redistributive effect. When we consider a stepwise approach, to first look at the effect of social transfers and then at the effect of taxes, we find that in Canada and the United Kingdom redistribution is mostly achieved through social transfers, whereas inequality reduction in Germany and the United States is achieved through both components rather equally. All four countries show that inequality trends are strongly influenced by inequality of market income. Since market income inequality is slightly reducing over the period 2000 to 2018 in the United Kingdom (and social transfers have been extended since the mid-2000s (Department for Work and Pensions, 2020)), inequality of disposable income decreased as well. This stresses the central role of social assistance benefits in redistribution. However, inequality started to increase again in the latest years, mostly due to rising inequality at the top 1 % (Bourquin et al., 2020). On the other hand, as market income inequality keeps increasing in Germany and the United States (and redistribution is held rather constant over the period), inequality of disposable income increased as well. In Germany, three elements lead to a rather substantially lower inequality as compared to the United States: market income inequality is lower, social transfers redistribution is larger, and tax redistribution is also larger. However, German inequality is catching up to yield similar levels, as present in Canada. Inequality on disposable income in Canada still slightly exceeds Germany, mostly due to a less redistributive effect in taxes.
Fig. 1. Gini Index trends in Canada, Germany, United Kingdom, and the United States
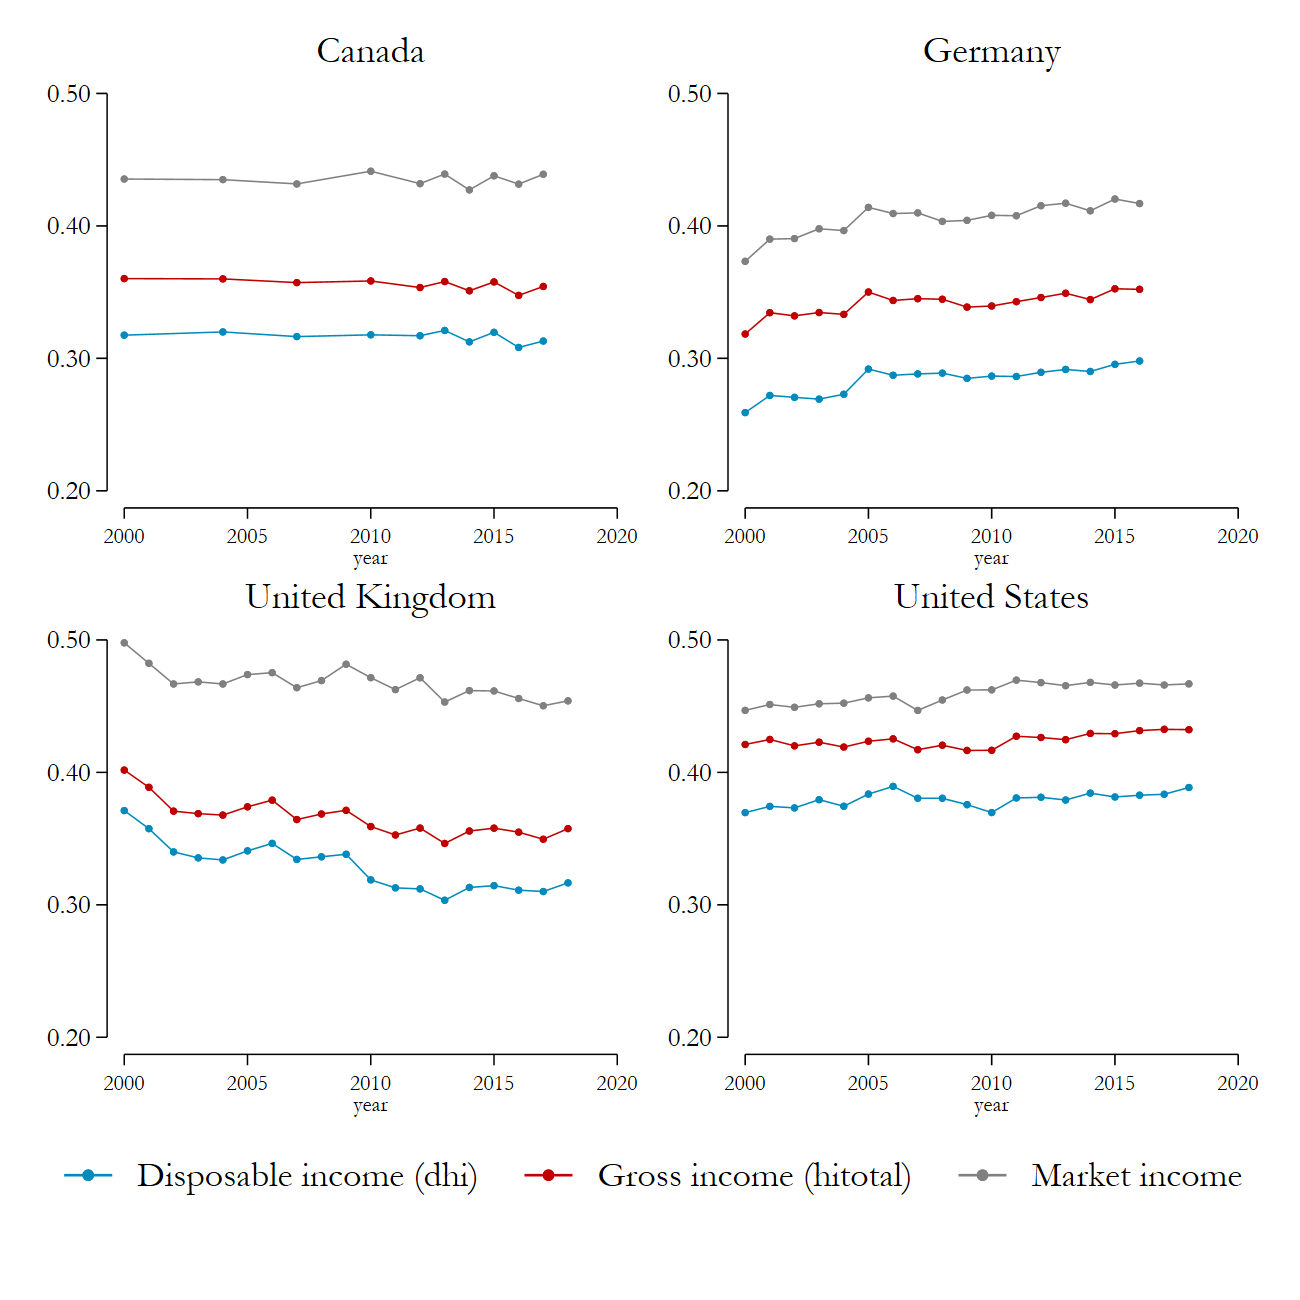
Note: Market income is defined here as factor income + contributory pensions + private transfers.
Source: Luxembourg Income Study (LIS) Database.
While Figure 1 above considered inequality as a whole in the total population (so that a higher inequality could possibly be due uniquely to the worsening of the situation of the poor, the improvement of the situation of the rich, or any combination of the two), in Figure 2, we take a closer look at how incomes have evolved at different points of the distribution. In order to do so, we take disposable income at three points of the distribution (the upper threshold of the first decile – percentile 10, the median, and the lower threshold of the highest decile – percentile 90). We plot the increases in real terms (in 2017 PPPs) for each of the three values over the period under consideration. Some rather different patterns emerge for the four countries considered. In Canada, even during the years of the financial crisis, the entire population seems to have benefitted rather equally of the large real growth that occurred between 2000 and 2017 (which, by the end of the period, reached rates of 30% for all three groups of the distribution considered here). The United Kingdom is the only one of the four countries to exhibit clear signs of pro-poor growth, at least until the first half of the 2010s, with increases at the bottom of the population on average twice as large as those at the top. Especially during the financially crisis years, the upper half of the population suffered negative growth, while persons at the bottom experience small growth rates. These findings are well reflected in the figures above that pictured the UK as the only country with slightly decreasing overall inequality, albeit the trend is clearly reversed for the latter part of the period (as also shown in Bourquin et al., 2020). The small distance of the growth lines to the horizontal baseline highlight the absence of growth in Germany as well as in the US until 2014 (except for the top). This is particularly visible in Germany, where the growth rate of the percentile 90 reached a peak of above 10% by 2016. At the same time, the percentile 10 shows a substantial decline in real values over the same period. Also the increasing American inequality seems to be mostly driven by the large gains at the top, with little difference between the bottom and the median.
Fig. 2. Real growth trends in Canada, Germany, United Kingdom, and the United States
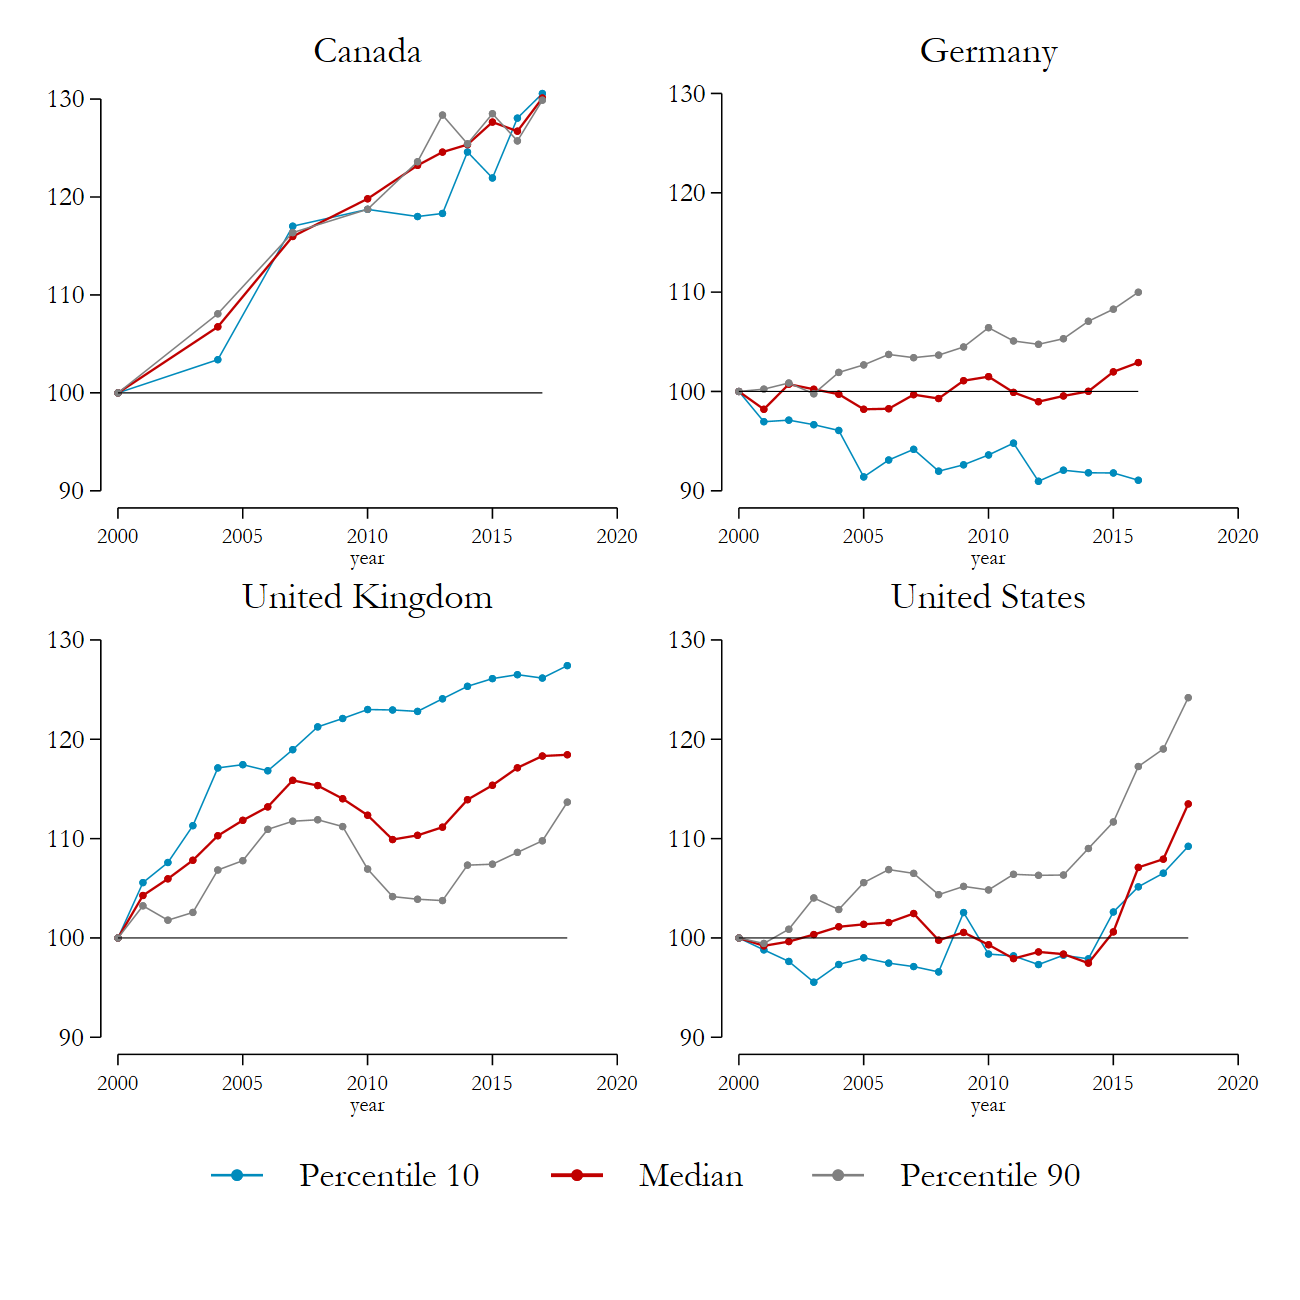
Notes: Market income is defined here as factor income + contributory pensions + private transfers.
Source: Luxembourg Income Study (LIS) Database.
Having analysed the over-time dimension, we focus now on further exploring one cross-section, year 2016. Figures 3.1 and 3.2 exemplify how tax redistribution (social contributions and income taxes) varies across the income distributions in these four countries. Figure 3.1 displays on the x-axis gross income equivalised by the square root scale expressed in 2017 PPP amounts. In this way, income amounts can be directly compared across countries. The points shown refer to the distribution of gross income divided in 100 percentiles. For each percentile, we calculated a mean tax rate, derived from the difference in gross and net amounts.
Thus, each point (x1,100,y1,100) refers to the average tax rate for the average gross income in the respective percentile. Figure 3.2 slightly adjusts the perspective to evaluate the same numbers. On the x-axis we plot the same gross income values scaled to the 100 percentiles, on the y-axis we show the average amount of taxes paid for each percentile.
In both figures, the bottom three percentiles have been supressed due to negative values in gross income. Respectively the very high amounts of the three percentiles at the upper end are not shown for visual clarity. We explicitly acknowledge the extraordinary importance of the top three percent in the overall impact of the tax budget and redistribution, but we aim to focus here on comparing the overall structure of the tax system and redistribution across the whole distribution.
Figure 3.1 shows that the countries vary considerably with respect to the tax burden at similar levels of income. For example with an amount of 35 000 dollars (approximately the median income in all four countries) the tax burden is the highest in Germany and the lowest in the United States. This results also in the highest tax amounts paid at the median in this comparison (see Figure 3.2). Showing the progressivity of the tax system, tax rates and income amounts further increase with income in all four countries, but with different patterns. Figure 3.1 mirrors well the high inequality at the top in the United States, in that, although the rich are taxed rather low as compared to the rich in Germany, still results in higher tax amounts paid for the top ten percentiles (Figure 3.2).
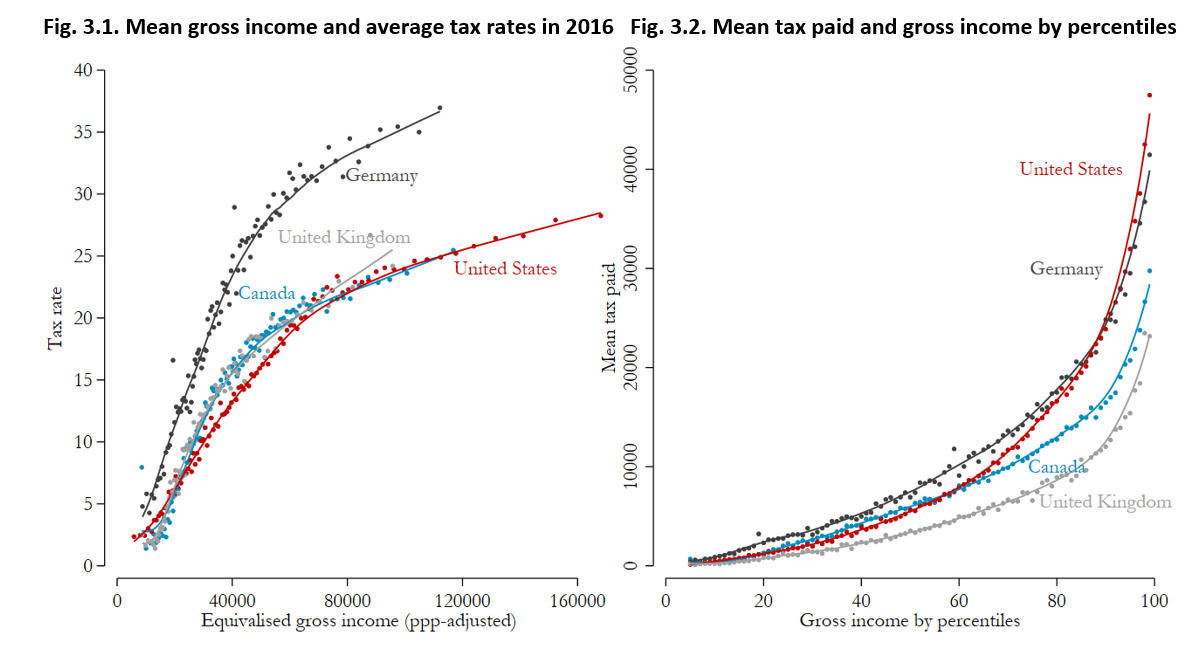
Notes: Gross income is equivalised by the square root of household members and expressed in 2017 PPPs.
Source: Luxembourg Income Study (LIS) Database.
Two notes of caution need to be placed here. First, tax information is collected very differently in these four countries. In Canada taxes and contributions are available from tax registers, in Germany and the United States they are simulated from gross income, and in the United Kingdom they are fully collected through survey questions. This leads to rather good representative numbers in the micro data with a view to National Accounts numbers (not shown here) in Canada, Germany, and the United States, whereas in the United Kingdom, taxes are slightly less representative, but particularly social contributions are insufficiently captured. Thus, the curves shown for the United Kingdom might need to be slightly adjusted upwards. A second note of caution refers to the United States. As is shown in the United States, taxation occurs already in the low incomes; this is a snapshot before refunding of tax credits happened; in the LIS data tax credits are considered as income, and are thus included in gross income.
Conclusion
In this article, we presented some evidence on the inequality trends and the impact of State redistribution on inequality for four advanced countries over the period 2000 to 2018. The main results for each of the four countries can be summarised as follows.
In Germany, the increase in market income inequality (notably due to stagnation of wage income and a modest positive growth limited to the upper half of the distribution) coupled by the absence of substantial efforts in terms of further redistribution (possibly due to the fact that the German welfare system is already among the most redistributive ones) are bringing the historically low levels of German disposable income inequality to increase towards the same levels of medium-inequality countries like Canada. On the other hand, the efforts in terms of increased redistributive role of the State at the beginning of the period, and the response to the peaks in inequality preceding the financial crisis, have driven the relatively highly unequal United Kingdom to show slightly decreasing patterns of inequality over the overall period, while at the same time exhibiting substantial growth rates. With stable levels of market inequality and redistribution, Canada has managed to achieve the highest growth over the period, equally benefitting the whole population, hence keeping its inequality stable. Finally, as far as the US are concerned, an increasing market income inequality, a modest redistributive effort (if at all), together with an income growth mostly concentrated at the top of the distribution, have implied a further worsening of the inequality situation, leaving the country by far as the most unequal among the advanced economies.
Two notes of caution should be raised here. First, those trends seem to be changing for the very last years of the 2010 decade in the UK and the US, with clear signs of a reversal of the situation in the UK, and of a much higher overall growth in the US. It would thus be important to re-evaluate the situation once more up-to-date data for all four countries are available. Secondly, we acknowledge that our viewpoint is a rather narrow one, which should be complemented by decomposing the analysis for further population subgroups, hence giving a better picture of how inequality affects the different segments of the population.
Finally, we would like to emphasise how, as shown in the last section of the article, the impact on inequality of the different taxation systems deserves special attention. The snapshot presented for 2016 shows how the German taxation system provides tax rates which are way larger than those of the other countries, but the long tail in the US distribution implies that the US collect higher amount of taxes from the rich than Germany. This finding gives food for thought for analysing particularly the redistributive effects of tax systems. Who possibly could and should contribute the most to redistribution? Who benefits from social redistribution? While it is clear that redistributing cash transfers towards the most needy part of the population is a pre-condition to reduce inequality (“There’s no substitute for just giving poor people money”, as claimed by David Brady and Zachary Parolin during a recent interview by the Stone Center on Socio-Economic Inequality on March 11 2021), the debate on taxing the rich needs more evidence-based analysis on its impact on social redistribution for different groups of the population.
References
| Bourquin P.; Joyce, R.; Norris Keiller, A. (2020). Living standards, poverty and inequality in the UK, IFS, June 2020. |
| Causa, O. and Hermansen, M. (2018). Income Redistribution Through Taxes and Transfers across OECD Countries, LIS Working Paper No. 729, LIS Cross-National Data Center in Luxembourg. |
| Department for Work and Pensions (2020). Households Below Average Income: An analysis of the UK income distribution: 1994/95-2018/19, National Statistics, March 2020. |
| UN Development Programme (UNDP) (2013). Humanity Divided: Confronting Inequality in Developing Countries, November 2013. |