Issue, No.13 (March 2020)
Income Composition Inequality: A Novel Approach to Distributional Analysis
One of the major findings of Piketty’s Capital in the XXI Century (Piketty, 2014) is the rise in the capital share of income in many advanced economies. From a technical perspective, the capital share of income is a simple ratio of capital to total income in a given economy. It is thus a number that ranges between zero and one: it is equal to one when an economy’s national income is entirely composed of profits and to zero when it is entirely composed of wages. From a conceptual perspective, both the level and trend of a country’s capital share of income provide us with crucial information on the same country’s economic structure. The level can indeed be regarded as a measure of the bargaining power different social groups with conflicting interests (such as “workers” and “capitalists”) have. At the same time, its longer term dynamics are driven by important global phenomena such as technological progress and financialization.
In this article I will address a simple question: how do the dynamics of the capital share of income affect inter-personal income inequality? Or in other words: how does the distribution of capital and labor in national income, also called functional income distribution, relate to the distribution of income among individuals?
Many scholars have studied this issue, especially during the last few decades. In his book, Thomas Piketty assumes the variation of these two variables, – variation in the share of capital income and in income inequality, – to be positively associated. This assumption is motivated by the fact that capital incomes tend to be mainly concentrated in the hands of those at the top of the income ladder.
From an econometric perspective, Bengtsson and Waldenström (2018) find evidence of a strong positive link between the functional and personal distribution of income, a link which has grown stronger over the past century. In contrast, Francese and Mulas-Granados (2015), based on an analysis that covers 93 countries between 1970 and 2013, find that the distribution of income between labor and capital has not been a major factor in explaining changes in income inequality.
The conflicting nature of these results highlights that this relationship is not “as simple and unambiguous as it may seems”, to use Milanovic’s own words (Milanovic, 2017). In a recent article I argue that, in order to study this relationship, we need to introduce a novel inequality concept that I termed income composition inequality. Furthermore, in the same article I constructed a new statistic called the Income-Factor Concentration (IFC) index, which serves for its measurement (Ranaldi, 2020).
In this piece, I will introduce both the novel concept of income composition inequality and the IFC index. Furthermore, I will illustrate how this approach can be useful to carry out a novel political-economic analysis of contemporary capitalist economies. To this end, an application of this method to the Italian context will also be presented (Iacono and Ranaldi, 2018).
I will start by introducing the concept of income composition inequality with a simple example. Let us suppose a stylized society consisting of two individuals only, Adrien and Beatrice. Suppose that Adrien and Beatrice have the same level of income, which is of $1000 per month. The total income inequality in this society is therefore zero. But what can we say about the composition of Adrien and Beatrice’s incomes? Suppose, for instance, that Adrien’s monthly income consists entirely of profits since he receives the monthly rent from a house in Paris that he owns. Beatrice’s income instead consists entirely of her salary as a teacher in the high school. To sum up, Adrien and Beatrice have the same level of income but a completely different source of income. Suppose now that both Adrien and Beatrice earn 50% of their incomes from labor and 50% from return on capital. The composition of their incomes is now exactly the same. To sum up, in the first scenario the composition of the two income sources was unequally distributed across Adrien and Beatrice, whilst in the second scenario it was equally distributed between them.
Bearing in mind the previous examples, we can now easily grasp the more formal definition of income composition inequality, as follows: if we decompose total income into two components, such as capital and labor income, then income composition inequality is the extent to which income composition is distributed unevenly across the income distribution. Inequality in income composition is maximal when individuals at the top and at the bottom of the income distribution separately earn two different types of income, such as capital and labor income. It is minimal when each individual has the same composition of capital and labor income.
From a more technical point of view, we can say that income composition inequality links the functional and personal distribution of income. This entails a straightforward observation: if the rich earn all the capital income in an economy, then an increase in the capital share of income makes the rich richer. Consider once again the stylized society previously described, in which Adrien was the only capital income earner. If the capital share of income grew by a certain amount (holding its distribution across individuals constant), then Adrien’s income would increase, and inequality across total income subsequently also.
From a more political-economic perspective, income composition inequality can provide insights into the degree of capitalism of a social system (Milanovic, 2017). Indeed, under high income composition inequality a society can be seen as an example of classical capitalism, where the rich earn the capital income and the poor the labor income. In contrast, under low income composition inequality a society can be regarded as exemplifying new capitalism, where both rich and poor have the same composition of capital and labor income.
Once agreed on the definition of income composition inequality, the next step concerns its measurement. Although there may be many different ways to measure income composition inequality, I favor one method in particular. To this end, let me first recall the notion of concentration curves, an important tool for distributional analysis, first introduced in the 1970s (see, for instance, Kakwani, 1977).
The concentration curve is a curve that cumulates the relative share of a given variable (such as capital income) across the population with individuals ranked according to another variable (such as total income). Suppose that Adrien has an income of $100, which is composed of $10 of capital income and $90< of labor income, whereas Beatrice has an income of $1000, which is composed of $900 of capital income and $100 of labor income.
To construct the concentration curve for capital income with individuals ranked according to their total income one firstly needs to rank individuals from the poorest (Adrien) to the richest (Beatrice). Then, one has to calculate their relative shares of capital income. The latter equals 10/910 for Adrien (Adrien’s capital income over total capital income in the economy), and 900/910 for Beatrice. The concentration curve for capital income cumulates these two numbers across the income distribution. The final concentration curve will, hence, be characterized by the three distinct pairs: (0,0), (1/2, 10/910) and (1,1). If one now multiplies the concentration curve just constructed by the total capital income share in the economy (which is 910/1100 in this case) one obtains what I would call the concentration curve for capital income. Figure 1 shows the concentration curve for capital income (blue line) for Italy in 1989.
Figure 1. Concentration Curves for Income Source – Italy, 1989
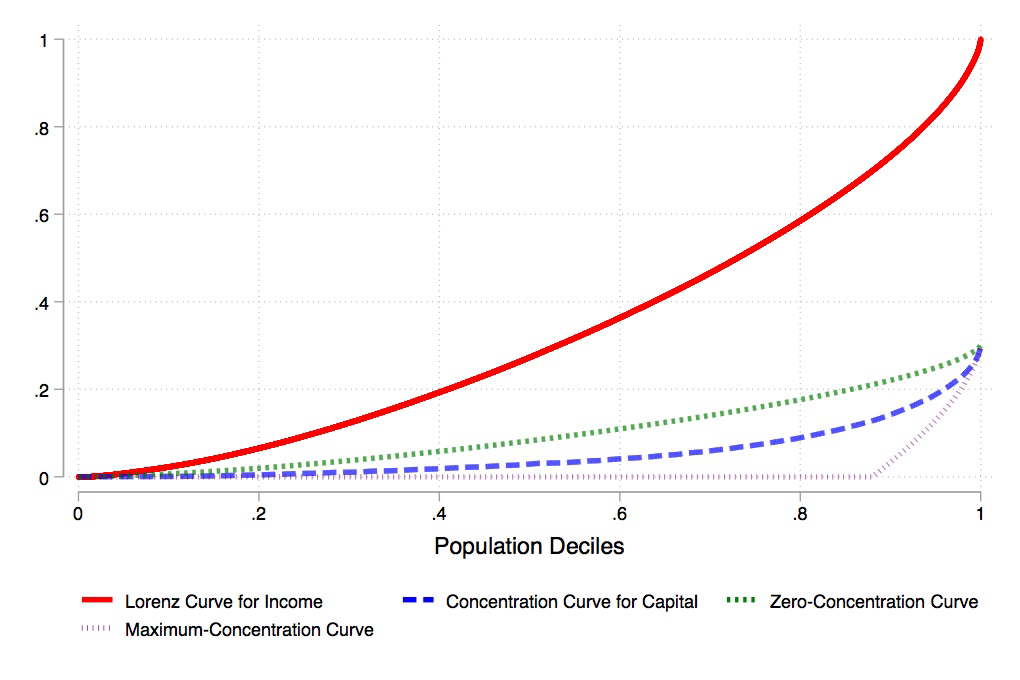
Note: The concentration curve for capital (blue line), the zero-concentration curve (green line), the Lorenz curve for income (red line) and the maximum-concentration curve (purple line) for Italy in 1989 are presented using data from the 1989 Survey on Household Income and Wealth (SHIW) carried out by the Bank of Italy. Capital income is defined as the sum of property income and the capital component of net self-employment income. Labor income is instead defined as the sum of payroll income, pensions, net transfers and the labor component of mixed income. Both the capital and labor components of self-employment income are imputed following Glyn (2011). The IFC index is defined as the ratio between the area between the zero-concentration curve and the concentration curve for capital income, and the area between the zero- and the maximum-concentration curves. The higher the numerator, the more capital income is concentrated at the top of the total income distribution and the stronger the link between the functional and personal distribution of income, as an increase in the overall capital share would increase the income of those at the top of the total income distribution, and hence increase personal inequality.
As can be seen, the concentration curve for capital income is almost flat up until the 4th decile. This means that the bottom 40% of the total income distribution earns almost no capital income, which is instead concentrated at the very top of the total income distribution, as the concentration curve starts growing very rapidly from the 90th percentile onwards. In correspondence with the 100th percentile the concentration curve reaches the point 0.3, which is the overall capital share of income captured by the survey.
In sum, the more “convex” the concentration curve is, the more concentrated is the capital income at the top of the total income distribution. Similarly, the more “concave” the concentration curve is, the more concentrated is the capital income at the bottom of the total income distribution. Although the concentration curves provide a clear, graphical indication of the direction of concentration (either at the top or at the bottom), we still do not know how to measure the extent of such a concentration.
To answer this question, we need to introduce two benchmark conditions: the benchmark of zero- and of maximum-concentration of income sources, together with their related concentration curves. We say that there is zero concentration of income sources when the composition of capital and labor is the same for all individuals (i.e. Adrien and Beatrice have the same shares of capital and labor income in their total income). The curve that describes this distribution of income sources is the Lorenz curve for total income, multiplied by the capital share (green line in Figure 1). The zero-concentration curve is the benchmark of zero inequality in income composition. This curve should be seen as the equivalent of the egalitarian line used to calculate the Gini coefficient. However, differently from the egalitarian line, the zero-concentration curve changes as the Lorenz curve and the functional distribution of income change. In contrast, we have maximum concentration of income sources when the bottom p percent of the total income distribution earn from one single source, and the top 1-p percent of the income distribution earn from the other source.1 The maximum-concentration curve is hence flat up to a given threshold, and then cumulates all the capital income in the hands of the remaining fraction of the population. It is important to notice that the maximum-concentration curve can potentially describe a distribution of income sources in which capital income is concentrated at the bottom of the total income distribution and labor income at the top (as unlikely it may seem). The maximum-concentration curve is, hence, the benchmark of maximal inequality in income composition.
Now that the concentration curve for capital income and the benchmarks for minimal and maximal inequality in income composition have been introduced, we can define the first measure of income composition inequality. If we denote by A the area between the zero-concentration curve and the concentration curve for capital, and by B the area between the zero and the maximum concentration curves, I define the income-factor concentration (IFC) index as the ratio between A and B.
The IFC index is a number ranging between 1 and -1. It is equal to 1 when capital income is concentrated at the top (and labor income at the bottom), whereas it is equal to -1 when capital income is concentrated at the bottom (and labor income at the top). Finally, it is equal to 0 when the composition of capital and labor is the same across the total income distribution. From a mathematical standpoint, it can be easily shown that the derivative of the Gini coefficient to changes in the functional income distribution is equal to the numerator of this statistic (i.e. A). This makes the IFC index the first measure of the link between the functional and personal income distribution. By applying the IFC index to the case of Italy between 1989 and 2016, Roberto Iacono and I find that income composition inequality has steadily decreased in Italy over the period considered (see Figure 2).
Figure 2. Income Composition Inequality – Italy, 1989:2016
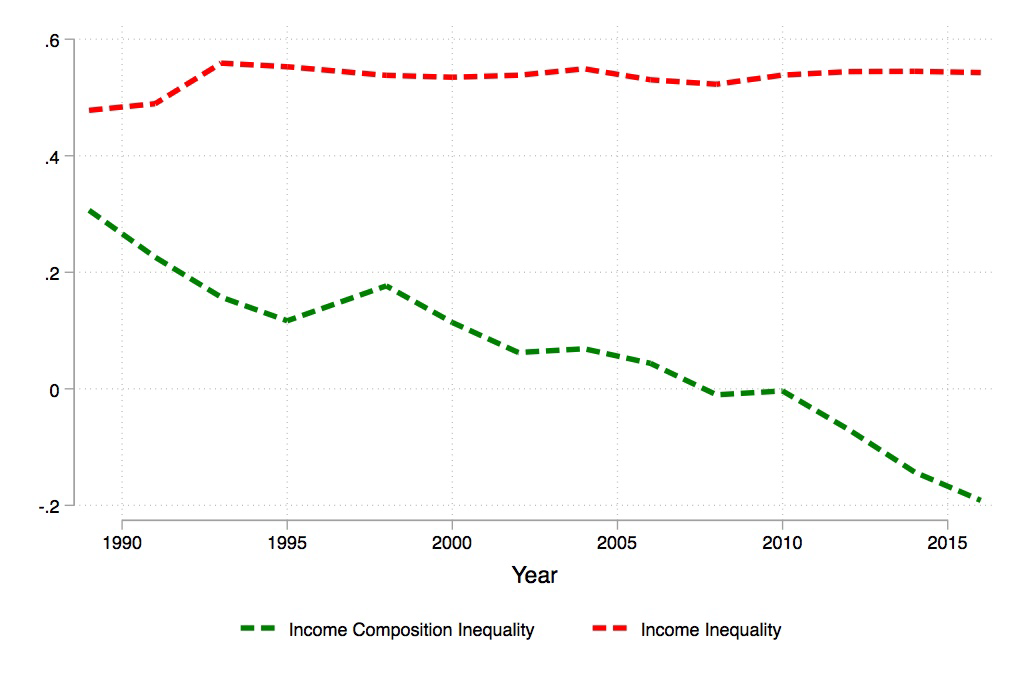
Note: The two series of income composition inequality, as measured by the IFC index, and of income inequality, as measured by the Gini coefficient, for Italy between 1989 and 2016 are constructed using the SHIW data. Capital income is considered as the sum of property income and the capital component of net self-employment income and labor income as the sum of payroll income and the labor component of net self-employment income. Total income is the sum of capital and labor income as previously defined.
The implications of this result, which is robust to different definitions of capital and labor income, are twofold. First, fluctuations in the total factor shares of income are having an increasingly weaker impact on income inequality in Italy. This latter aspect is a direct consequence of the decrease in the IFC index: the lower the IFC index, the less capital income is concentrated at the top (of the total income distribution), the weaker the link between the functional and personal distribution of income. Under a weak link between the functional and personal distribution of income, an increase in the capital share has almost no effect on inter-personal inequality. Second, Italy is moving towards practising a new type of capitalism, in which individuals earn from multiple sources of income and the dichotomy between “rich capitalist” and “poor workers” does not seem to hold anymore. This fact underlines some major changes in the structure of the Italian economy. As shown in Figures 3 and 4, Italy has become more of a home-owning society (as real estate is now more equally distributed across the total income distribution). At the same time, both self-employment and payroll incomes have moved from the bottom to the top of the total income distribution, suggesting a change in the composition of the top income earners. These components are the ones responsible for the fall in income composition inequality over the last three decades in Italy.
Figure 3. Area of the Concentration Curves – Capital Income Components
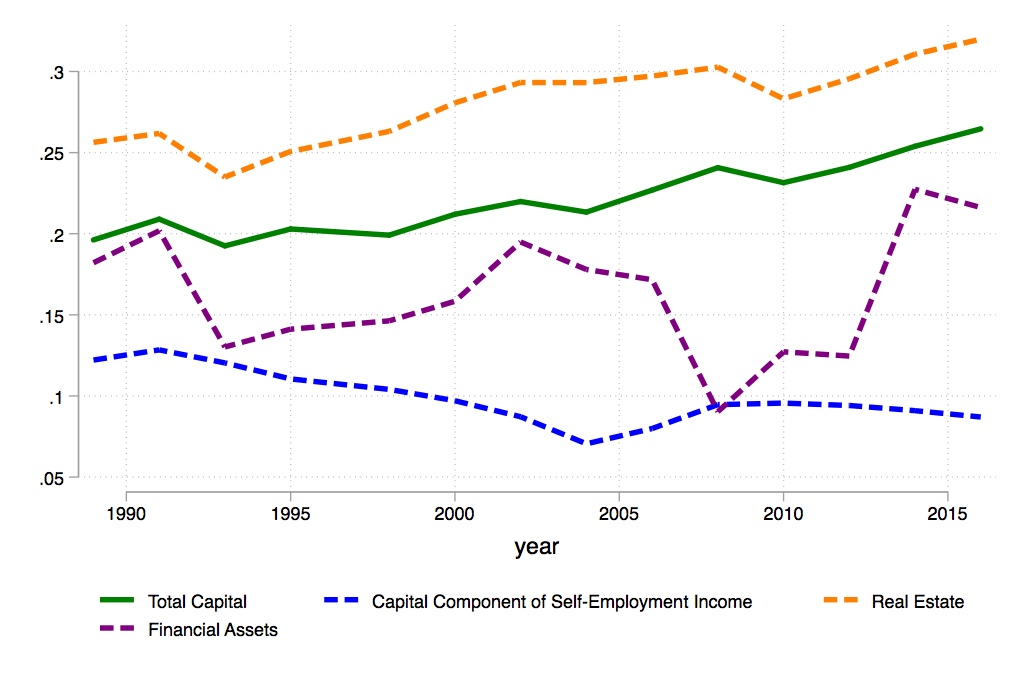
Note: The series of the area of the concentration curve for capital (green line), together with the area of the concentration curves for the capital component of self-employment income (blue line), real estate (orange line) and financial assets (purple line), for Italy between 1989 and 2016 constructed using the SHIW data. When the area of the concentration curve for total capital (for instance) increases, then total capital is becoming more equally distributed across the income distribution. The reverse situation happens when the areas decreases.
Figure 4. Area of the Concentration Curves – Labor Income Components
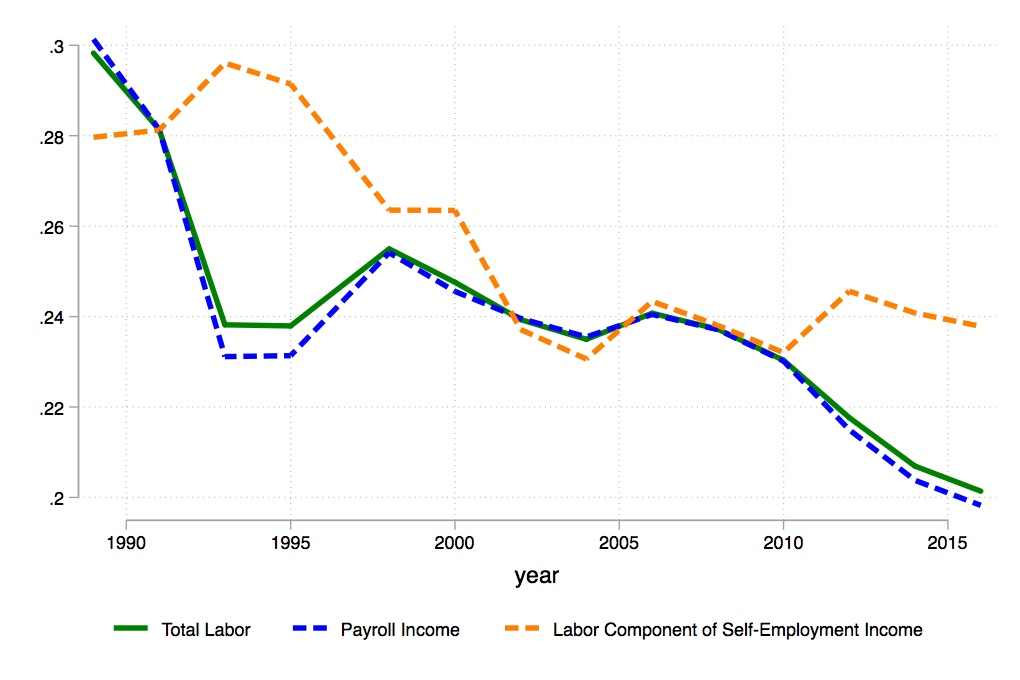
Note: The series of the area of the concentration curve for labor (green line), together with the area of the concentration curves for payroll income (blue line) and the labor component of self-employment income (orange line), for Italy between 1989 and 2016 constructed using the SHIW data. When the area of the concentration curve for total labor income (for instance) increases, then total labor income is becoming more equally distributed across the income distribution. The reverse situation happens when the areas decreases.
To sum up, in this article I introduced a novel inequality concept that I term income composition inequality. I argued that income composition inequality links functional and personal distribution of income and allows for a novel political-economic analysis of contemporary capitalist economies à la Milanovic. Then, I introduced the Income-Factor Concentration Index, a summary statistic constructed to measure the degree of income composition inequality. Finally, I showed the evolution of income composition inequality in Italy over the last three decades and how it has steadily decreased over this period.
It is of the utmost importance to highlight that, while I use capital and labor as income components in this paper, the study of income composition inequality can be applied to analyze the joint distribution of any pairs of income (or wealth) components, such as net income and taxes, savings and consumption, or financial and non-financial assets, among others. The flexible nature of income composition inequality therefore paves the way for future research on the topic.
1We refer the reader to the scientific article for a better understanding of the precise choice concerning the fraction p.
References
| Bengtsson, E., Waldenström, D. (2018), Capital Shares and Income Inequality: Evidence from the Long Run. Journal of Economic History, Vol. 78, Issue 3, pp.712-743. |
| Francese, M., Mulas-Granados, C. (2015), Functional Income Distribution and Its Role in Explaining Inequality. IMF Working Paper, WP/15/244. |
| Iacono, R., Ranaldi, M. (2018), Sources of Inequality in Italy. Working Paper 479, ECINEQ, Society for the Study of Economic Inequality. |
| Kakwani, N. (1977), Application of Lorenz Curves in Economic Analysis. Econometrica, Vol. 45, No. 3, pp. 719-728. |
| Milanovic, B. (2017), Increasing Capital Income Share and its Effect on Personal Income Inequality. In H.Boushey (ed.), After Piketty. The Agenda for Economics and Inequality, J. Bradford DeLong, Marshall Steinbaum. Ch. 10. |
| Piketty, T. (2014), The Capital in the XXI Century. Harvard University Press. |
| Ranaldi, M. (2020), Income Composition Inequality. Stone Center Working Paper Series, No. 07. |