Issue, No.9 (March 2019)
How does benefit underreporting affect our understanding of poverty and inequality in the United States?
Estimates of poverty and income inequality are only as reliable as the data from which they are derived. Nearly all estimations of household income that include the U.S., however, are based on a source of data that suffers from the underreporting of means-tested transfers. Put differently, the social transfers that many low-income households in the U.S. receive often do not show up in U.S. household survey data. As quantitative researchers, how concerned should we be about this source of measurement error in the U.S. data? And in what ways might benefit underreporting affect our understanding of the determinants and composition of poverty? These are among the questions I have worked to address throughout the past two years.
Before diving into the answers, it is useful to cover a few basics. First, the data in question is the U.S. Current Population Survey (the CPS ASEC). The CPS ASEC includes the most detailed set of income information for households in the U.S. and is the data most often used to produce American poverty estimates. In addition to being used for the majority of intra-U.S. poverty research, the CPS ASEC is used as the input data for LIS.
A second point: though I focus mostly on the CPS ASEC, it is certainly not the only set of survey data that suffers from measurement concerns. Any survey that requires respondents to recall information from their past, or to share potentially sensitive information, is susceptible to measurement error (Jäntti et al. 2013). Fortunately, we can often benchmark survey responses against register or administrative data to check for consistency. More often than not, the survey data pass the test. Sometimes, though, imperfections appear. As some examples, mismatches between survey data and administrative records have been identified among earnings data in Denmark (Kristensen and Westergard-Nielsen 2006), earnings and pensions in Sweden (Kapteyn et al. 2007), total household income in France, and transfer income in Italy (Jäntti et al. 2013), all to varying extents.
But, back to the U.S.: when should we be concerned about benefit underreporting? Below, I highlight three key lessons from recent research.
U.S. survey data suffers greatly from the underreporting of social transfers.
Benefit underreporting is particularly concentrated in three social programs: the Supplemental Nutrition Assistance Program (SNAP, often referred to as food stamps), Temporary Assistance for Needy Families (TANF, a state-run social assistance program), and Supplemental Security Income (SSI, a means-tested income supplement targeted at blind, disabled, and/or older-age adults). Combined, these three programs accounted for more than $130 billion in cash or near-cash transfers in 2015. More than a third of this sum (around $45.6 billion), however, is unmeasured in the CPS ASEC in 2015, leading to an underestimation of household incomes toward the bottom of the income distribution. Evidence suggests that benefit underreporting has worsened in U.S. survey data over time.
In a recent paper at Social Indicators Research, I utilize a microsimulation tool from the Urban Institute, a think tank in Washington, D.C., to adjust for the benefit underreporting and re-evaluate poverty outcomes in the U.S. The Urban Institute’s “Transfer Income Model 3”, or TRIM3, is a sophisticated simulation tool that utilizes information about each individual and household in the CPS ASEC to predict their likelihood of benefit receipt, as well as the value of benefits that a recipient is likely to receive. The TRIM3 simulations take into account data from federal and state administrative records, as well as individual/household data on race, ethnicity, immigrant status, marital status, household structure, state of residence, income, state-level policy rules, and more to estimate program participation and benefit levels. The simulated SNAP, SSI, and TANF benefit levels can be used in place of reported values to adjust for under-reporting within the CPS ASEC.
As discussed in more detail in the paper, TRIM3 is not perfect. But, given the absence of available administrative records, it offers a promising step forward toward producing more accurate estimates of poverty in the U.S. In all, TRIM3 brings in more than $30 billion worth of social transfers back into the dataset in 2015, and comes much closer to matching administrative records on the total levels of SNAP, TANF, and SSI benefits allocated to the public (Parolin 2019).
Benefit underreporting affects estimates of the incidence and composition of poverty in the U.S., and ‘extreme’ poverty in particular.
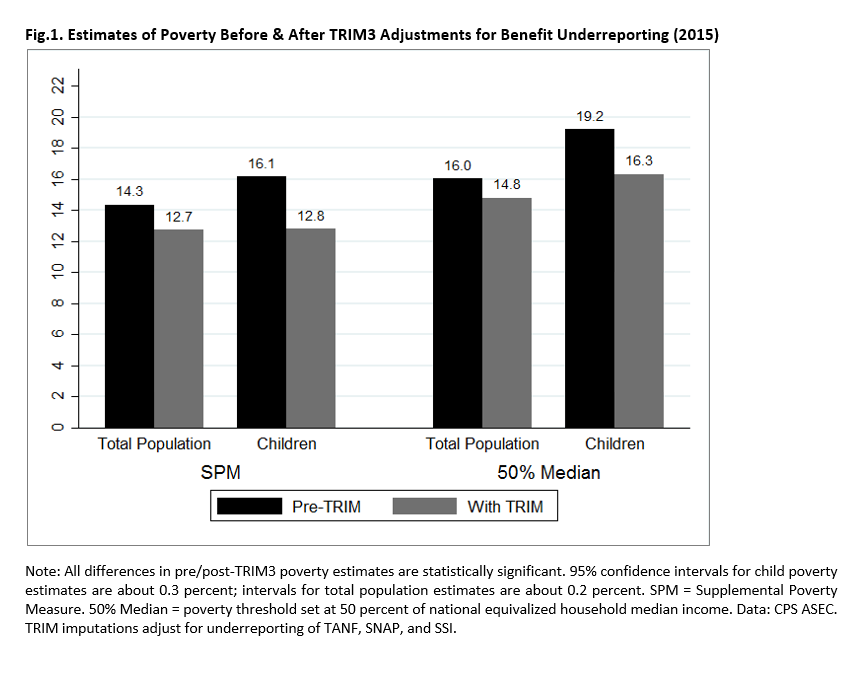
As expected, bringing the missing benefits back into the household data has an effect on estimates of poverty in the United States. This is particularly true for households with children, the primary beneficiaries of SNAP and TANF benefits. Figure 1 below shows the changes in poverty rates in 2015 before and after applying the TRIM3 benefit adjustments. The left half of the figure shows changes in rates according to the Supplemental Poverty Measure (SPM), a quasi-relative poverty measure used within the U.S.. The right half of the figure applies the 50 percent of median income benchmark commonly used in comparative research.
For the 50 percent of median measure, we see a 1.2 percentage point (8 percent) reduction in overall poverty after applying the benefit adjustments. For children, however, the poverty rate falls by nearly 3 percentage points (15 percent). For the SPM, the declines are even steeper: a 1.6 percentage point (11 percent) drop for the entire population, and a 3.3 percentage point (20 percent) decline among children. These findings show not only that we are slightly overestimating the incidence of poverty in the U.S., but that social transfers in the U.S. are probably a little more effective than we often give them credit for.
Benefit underreporting particularly affects our understanding of the incidence and composition of households living in deep or extreme poverty. At the Journal of Poverty & Social Justice, David Brady and I took a revised look at the sources and composition of ‘extreme’ child poverty in the U.S. We find that estimates of the share of children living in $2 per day poverty, or below 10 percent of median income in the U.S., are very sensitive to benefit underreporting and choices regarding income measurement. When we adjust for underreporting of SNAP and include it in our income definition, for example, we find that levels of extreme child poverty decline from 1.84 percent to 0.11 percent, a relative decline of 94 percent. Moreover, we find that our understanding of who lives in extreme poverty changes drastically. Prior literature has pointed to the incidence of extreme poverty among single parents. In contrast, we find that 73 percent of children in extreme poverty live in households headed by a non-citizen. A straightforward policy response to reduce extreme poverty in the U.S. should thus ensure that non-citizens also have access to some form of social assistance (see Parolin and Brady 2019 for more details).
However, our findings also come with an important caveat: survey data of household incomes do not generally capture homeless families or individuals in transient housing situations. As such, any attempts to measure extreme poverty using survey data can only provide a lower-bound estimate of the true prevalence. In 2014-2015, the U.S. Department of Education identified 1.3 million children in public schools as homeless or living in precarious housing situations. Including these children in our counts of extreme poverty would substantially increase our estimates.
Benefit underreporting clearly has an effect on estimates of poverty in the U.S. But, to what extent does it affect our understanding of income inequality?
At the Journal of European Social Policy, Stefano Filauro and I set out to compare income inequality in the U.S. (after adjusting for benefit underreporting) to income inequality in the EU-28. LIS users know well that income inequality in the U.S. is higher than in most other advanced democracies. In Filauro and Parolin (2018), we find that even after adjusting for benefit underreporting, post-tax/transfer income inequality in the U.S. is higher than pan-European income inequality, as shown in Figure 2 below. In other words, when we aggregate all residents of EU Member States together and adjust for cross-national price differences, we find a Gini coefficient that is consistently smaller than that of the United States from 2006 onward.
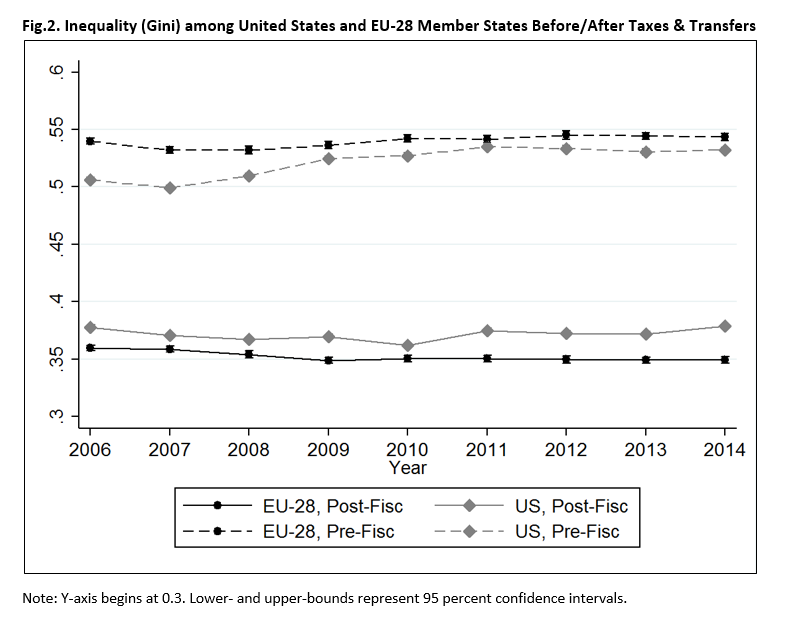
Clearly, benefit underreporting does not change the U.S.’s status as an outlier with respect to income inequality. Even after bringing the missing transfers back into the dataset, income inequality and poverty in the U.S. remain higher than in most peer nations.
So, to what extent should LIS users be concerned about benefit underreporting in the U.S.? At the least, LIS users should acknowledge the issue of benefit underreporting when interpreting estimates of poverty or income inequality from the CPS ASEC (or LIS micro-data). As exemplified above, adjustments for benefit underreporting could bring roughly half of TANF and SNAP transfers back into the survey data in recent years. In 2015, that amounted to more than $30 billion in transfers, primarily concentrated among low-income households with children.
Re-estimating poverty rates with the improved data shows that households with children are particularly affected. In 2015, relative child poverty rates declined from 19.2 to 16.3 percent after adjusting for benefit underreporting, or a 15 percent relative decline. For the population as a whole, poverty rates fell from 16 percent to 14.8 percent after applying the benefit adjustments. The farther down one goes in the income distribution, the more benefit underreporting matters. In assessing levels and trends of ‘extreme’ poverty in the U.S., for example, we saw that applying the TRIM3-adjusted income massively affects our understanding of who and how many Americans live with household income below 10 percent of the national median.
That said, the benefit adjustments do not change the position of the U.S. relative to other peer nations when it comes to indicators of economic wellbeing and social inclusion. Even after applying the TRIM3 adjustments, the U.S. features higher levels of income inequality (when measured with the Gini coefficient) compared to the combined EU-28. Moreover, the U.S. still features exceptionally high levels of poverty and income inequality compared to peer nations.
Ongoing efforts to link administrative records with CPS ASEC data should hopefully reduce concerns of measurement error in the future. For the time being, poverty and inequality scholars using U.S. survey data should press on with their work, but should acknowledge the possibility that benefit underreporting, if not addressed, may bias their results.
Zach Parolin completed his Ph.D. in Socio-Economics at the University of Antwerp. In April, he will start as a Post-Doctoral Research Associate at Columbia University’s Center on Poverty & Social Policy. You can follow Zach on Twitter at @zparolin
References
| Filauro, S. and Parolin, Z. (2018). Unequal unions? A comparative decomposition of income inequality in the European Union and United States, Journal of European Social Policy, (forthcoming), accessible online under: https://doi.org/10.1177/0958928718807332 |
| Jäntti, M. ; Törmälehto, V.-M.; Marlier, E. (2013). “The use of registers in the context of EU–SILC: challenges and opportunities”, Eurostat Statistical Working Papers. |
| Kapteyn, A. and Ypma, J. Y. (2007). “Measurement Error and Misclassification: A Comparison of Survey and Administrative Data”, Journal of Labor Economics, 25(3): 513-551. |
| Kristensen, N. and Westergard-Nielsen, N. (2006). “A Large-Scale Validation Study of Measurement Errors in Longitudinal Survey Data”, IZA Discussion Paper Series, 2939, (Institute for the Study of Labor (IZA)). |
| Parolin, Z. (2019). “The Effect of Benefit Underreporting on Estimates of Poverty in the United States”, Social Indicators Research (forthcoming), accessible online under doi: https://doi.org/10.1007/s11205-018-02053-0. |
| Parolin, Z. and Brady, D. (2019).“Extreme child poverty and the role of social policy in the United States”, Journal of Poverty and Social Justice, (forthcoming), accessible online under doi: https://doi.org/10.1332/175982718X15451316991601. |