Issue, No.12 (December 2019)
The Luxembourg Wealth Study Database Is Growing: Some New Results
With the emerging national surveys on household balance sheets and with the successful acquisition and harmonization of such datasets, the Luxembourg Wealth Study (LWS) Database has grown to one of the largest comparable databases on household wealth in the world. Currently, it covers nearly 20 countries. Recently, a new series of microdata has been added to the database for countries such as Luxembourg, Spain, and Japan. Furthermore, other countries, which have been less covered in the empirical literature, such as Chile or South Africa, will become part of the database in the near future. Expansion of the LWS Database and its cross-country perspective should allow researchers to shed light on interesting research topics such as, amongst others, differences in the composition of assets and liabilities across countries (e.g. Badarinza et al., 2016) or the study of differences in wealth distribution (e.g. Cowell et al., 2017). The main goal of this short note is to present several new results obtained from a comparative perspective, especially for the newly added countries.
First, there are remarkable differences in the household net worth levels across countries and over time. A glance at Figure 1 shows that median disposable net worth is the largest in Luxembourg with more than four hundred thousand $US. On the other hand, the lowest level of wealth can be seen in Germany, approaching around fifty thousand $US for the year 2017. Some of the considered countries experienced a drop in household wealth, especially after the financial crisis, but have more recently experienced a slight recovery (e.g. the United States). A remarkable hump-shaped pattern can be observed for the median net wealth evolution in Spain, with steady growth up to 2004 followed by a sharp decline. Finally, the median household net wealth in Italy steadily grew from 1995, peaked in 2010 at the level of above two hundred thousand $US, and then dropped by around 20% between 2010 and 2014.
Figure 1: Evolution of median net wealth across countries and over time
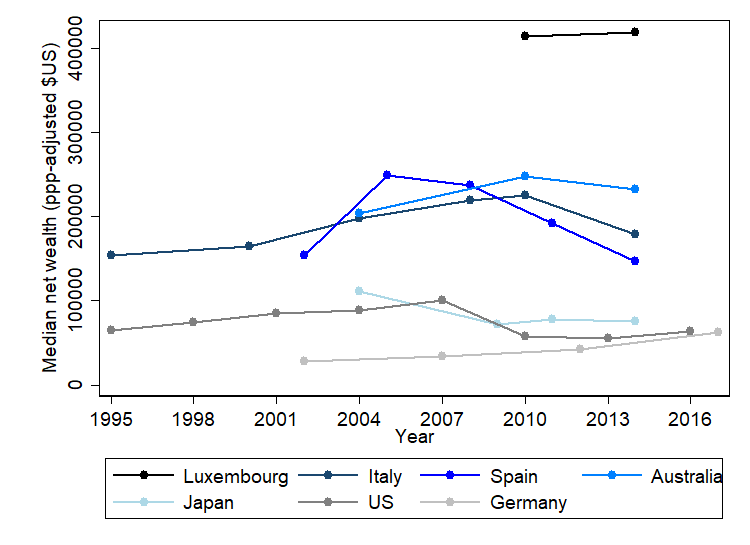
Notes: calculations carried out using survey weights and accounting for multiply-imputed data. Furthermore, all nominal values are expressed in 2011 $US prices using PPP deflators. Net wealth consists of real and financial assets (excluding pensions) less the liabilities. For Japan, business equity, consumer goods, and other real estate liabilities were not collected.
Source: Luxembourg Wealth Study (LWS) Database.
Second, when it comes to the allocation of household wealth to different asset classes, we can also notice substantial heterogeneity across countries. Figure 2 offers two views: composition of assets and composition of debts. While housing plays a very important role in household portfolios for countries such as Slovakia, Spain, and Luxembourg, it is less significant for the Anglo-Saxon countries and Germany. On the other hand, the importance of financial and private pension assets is more remarkable in Canada, Germany, and the US as compared to the first group of countries. As regards the composition of liabilities, similarly to asset composition, debts contracted for real estate acquisitions have bigger importance in Spain, Luxembourg, and Slovakia, as compared to Canada, and the US, where non-housing liabilities constitute almost 60% of the total debts.
Figure 2: Composition of household assets and liabilities across countries
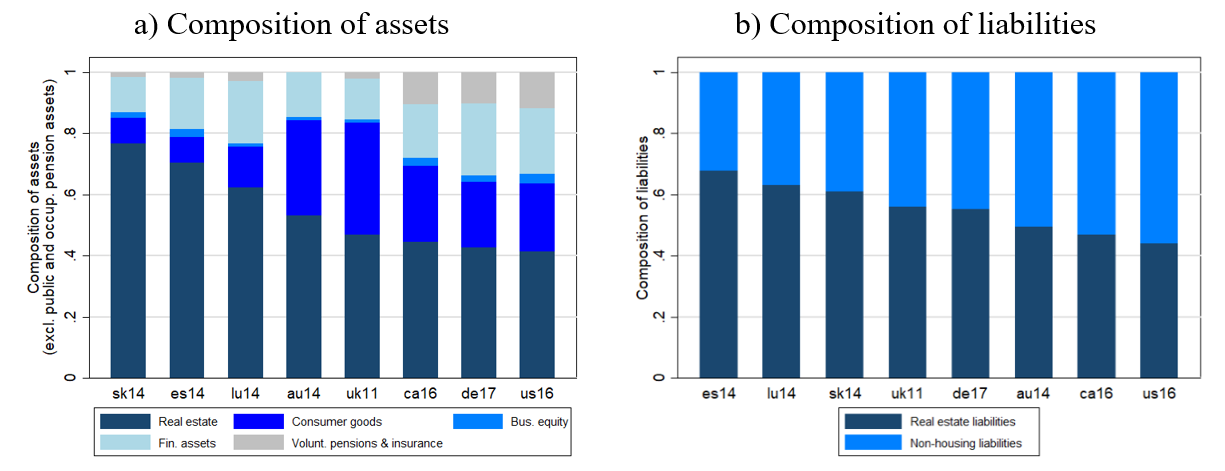
Notes: calculations carried out using survey weights and accounting for multiply-imputed data. Household assets do not include social security and occupational pension assets. Pension assets in Australia were collected at the aggregate level, thus the voluntary private pensions and life insurance cannot be separated. Although private pension assets make up a rather large portion of household portfolios in Australia, they cannot be presented in this chart for reasons of comparability.
Source: Luxembourg Wealth Study (LWS) Database.
Finally, Figure 3 offers a picture of the net wealth distribution across selected countries. It is well known that wealth is much more unequally distributed than household income or consumption. In this figure, we can see that while in Slovakia the top 10% of households hold slightly above 20% of the total nation’s wealth, in the US the situation is exactly the opposite with around 80% of the country’s wealth held by the top 10% of households. Wealth inequality is comparable across Spain, Luxembourg, and Germany, especially in the upper part of wealth distribution. Cross-country differences in wealth inequality might be explained by differences in the composition of household assets (see Figure 2). For example, Lindner (2015) found that wealth held in households’ main residence has the most equalizing effect on overall wealth distribution. In contrast, self-employment business assets tend to increase wealth inequality the most.
Figure 3: Distribution of net wealth across countries
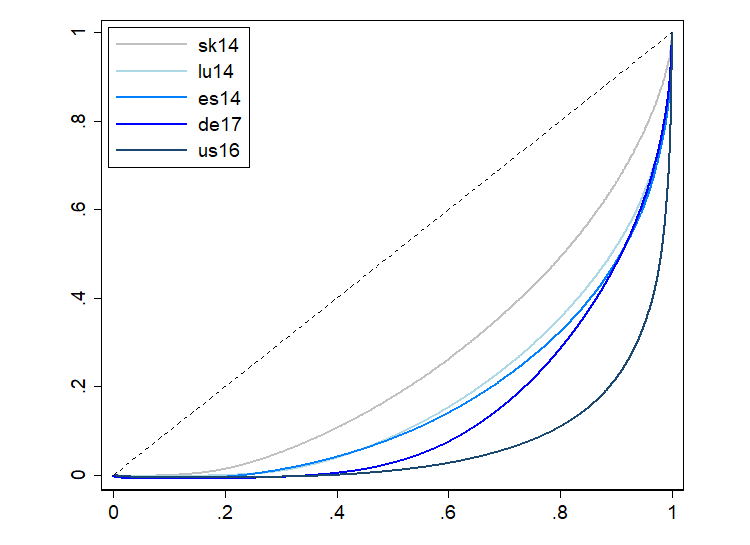
Notes: calculations carried out using survey weights and accounting for multiply-imputed data. Household wealth also includes voluntary private pensions and life insurance.
Source: Luxembourg Wealth Study (LWS) Database.
We believe that this snapshot of results will catch the attention of LWS Database users and encourage them to conduct fruitful research beyond the simple descriptive statistics presented in this highlight.
References
| Badarinza, C., Campbell, J. Y., & Ramadorai, T. (2016). ‘International Comparative Household Finance’, Annual Review of Economics, 8(2016), 111-144. |
| Cowell, F., Nolan, B., Olivera, J., & Van Kerm, P. (2017). Wealth, Top Incomes and Inequality, LWS Working Paper Series, No. 24, LIS Cross-National Data Center in Luxembourg. |
| Lindner, P. (2015). ‘Factor decomposition of the wealth distribution in the euro area’, Empirica, 42(2), 291-322. |