Issue, No.10 (June 2019)
Market income inequality, left-wing political parties, and redistribution in Latin America
This article is the outcome of an ongoing collaboration between Agence Française de Développement (AFD) and LIS, a more detailed working paper on this topic is in preparation.
Introduction
The objective of this article is to bring together two strands of literature in order to explore the factors behind the decrease of inequality in Latin America in the last decade of the 20th and the first decade of the 21st century. The first strand of literature deals with the median voter hypothesis that is supposed to explain why in more unequal democratic societies voters tend to favor redistribution. The second strand of literature explains the reasons behind Latin American decline in inequality emphasizing its left-wing political swing. Our objective is to test whether the median voter hypothesis in its revised form, the so-called “redistribution hypothesis”, combined with the information about democracy and political partisanship (left- vs. right-wing political parties in power) can shed additional light on the decrease of inequality in Latin American and Caribbean (LAC) countries.
How to correctly study redistribution
The by-now venerable median voter hypothesis was proposed by Allan H. Meltzer and Scott F. Richard (1981, 1983) as a way to explain redistribution of income through taxes and transfers. The idea is that people vote on redistribution packages based on their expectation of how much they will have to pay in direct taxes vs. how much they expect to gain from social transfers. If they are likely to gain (lose) in net terms they vote in favor of (against) greater redistribution. If market-generated income distribution is very unequal then more people have to gain from transfers, which in the simplest formulation are supposed to be equal per capita, than to lose from taxes. In such a way highly unequal market income distribution is self-corrective: it leads to more people favoring redistribution and thus ultimately to a reduction in inequality.
Milanovic (2000) tested the median-voter hypothesis by calculating the gain realized by different deciles of income distribution when people are ranked by their pre-fisc (market) income. Of the two prediction of the median voter hypothesis, namely (1) that the redistribution should rise with pre-fisc inequality, and that (2) the effect should be the greatest for the median voter, or at least, that the median voter should be a net beneficiary of redistribution, Milanovic finds a strong support for the first claim, but not the second. The greater the inequality in market incomes, the greater is redistribution and the gain monotonically decreases as we move toward the richer deciles (in pre-fisc terms). But the middle deciles (fifth or sixth) gain almost nothing or very little.
This has led Milanovic (2000) to formulate the “redistribution hypothesis” arguing that the gains are greater the lower is the market-income share of a decile but that we cannot ex hypothesi assert what would be the effect on the median voter. The key new variable named sharegain measures the difference in the share of income received by people in a given market income decile as the redistribution proceeds: first we look at their share in gross income (market income plus government transfers) and then their share in disposable income (gross income minus direct taxes). We thus observe how income shares of the same people change through the redistribution process: that is, whether they are “winners¨ or ¨losers”. This can obviously be done only if we have micro (household level) information. To clarify, if the bottom decile by market (pre-fisc) income share is, say 2 percent of total market income, and the share of the same people, after taxes and transfers, is 5 percent of disposable income, the sharegain for this decile is 3 percentage points.
In this paper, we apply the same approach to test the hypothesis on Latin American data. But in order to motivate it further and situate it in its political context, we look at redistribution together with political variables: level of democracy, and left-wing or right-wing political orientation (“partisanship”) of governments and legislatures. Not only is this a more realistic approach to redistribution, but it has been widely argued that the key impetus to Latin American inequality reduction (and greater redistribution) came from the left-wing governments that, approximately at the same time, came to power in Argentina, Bolivia, Brazil, Chile, Ecuador and Venezuela.
How are (non-anonymous) distributional data constructed
We use in total 239 surveys (country-years) from 20 Latin American and Caribbean countries (LIS supplies 49 surveys and SEDLAC 190 surveys) data to calculate market, gross, and disposable income.1 To measure redistribution, we first sort households into ten deciles according to their market income. To calculate gross incomes of the households in each market decile, government transfers are added to the market income of each decile. Finally, we calculate disposable incomes of the households in each market decile by deducting direct taxes. The difference between a decile’s share of total disposable (or gross) income and the same decile’s share of total market income is, as mentioned above, called the sharegain.
When redistribution is significant, we expect the market-income poor deciles to have positive (and large) sharegain; the sharegainshould monotonically decrease for higher market income deciles, eventually turning negative. A positive sharegain simply means that a given decile gains through the process of redistribution; a negative, that it loses. We shall focus on the share of the bottom four deciles in market income. When we use sharegain, the analysis is not anonymous: we look at whether the individuals who are market-income poor are benefitting and how much.
A short note on the political variables used from the World Bank Database of Political Institutions (DPI) (Beck, et al. 2001, Keefer and Milanovic 2014). The variables that we use are democracy and political alignment. For democracy, we use two specifications: a binary specification such that democracy takes the value of 1 only if the underlying DPI variables estimating the level of electoral competitiveness for the executive office (EIEC) and electoral competitiveness for legislature (LIEC) both take the highest value if 7 (otherwise democracy=0); and a quasi-continuous variable (EICE or LIEC) which runs from 1 to 7.2
Inequality and redistribution in Latin America (anonymous analysis)
While both market and disposable income inequality are high in Latin America, they have recently, and uniquely among regions of the world, been on the decline. This is a fact which is well-known and much discussed (Alvaredo and Gasparini 2013; Gasparini, Cruces and Tornarolli 2011; Ferreira, Leita and Litchfield 2007; Tornarolli, Ciaschi and Galeano 2018). However, given that inequality in Latin American countries and the Caribbean remained frequently well above the levels of advanced economies such as the US, the UK, Germany or the emerging South-Asian economies, there remains a paradox to be solved. Would not high market income inequality stimulate, as the Meltzer-Richard hypothesis implies, democratic countries like Chile, and Latin American countries in general, to redistribute more? This, however, is not the case to the same extent everywhere.
Figure 1 shows, using all LIS surveys available as of December 2018, the extent of market income inequality on the horizontal axis, and the reduction of Gini-measured inequality due to social transfers and taxes. We expect a positive relation between the two. This is the case when we look at countries colored blue that are in Western Europe, North America and Oceania (most of LIS dataset). When we run a regression between market Gini and extent of redistribution (Gini reduction) on these countries the coefficient linking the two (β) is positive (0.66) and highly statistically significant. It means that on average for each additional Gini point of market income inequality, redistribution is 0.66 Gini points greater. (If β were equal to 1, all increases in market income inequality would be fully offset through greater redistribution.) The relation is also positive for East European countries (denoted red) although the coefficient is smaller (0.37). The Asian countries (denoted black) available in LIS are few in numbers but they fit (especially so Taiwan) the overall pattern very well: they have low market income inequality and low redistribution.
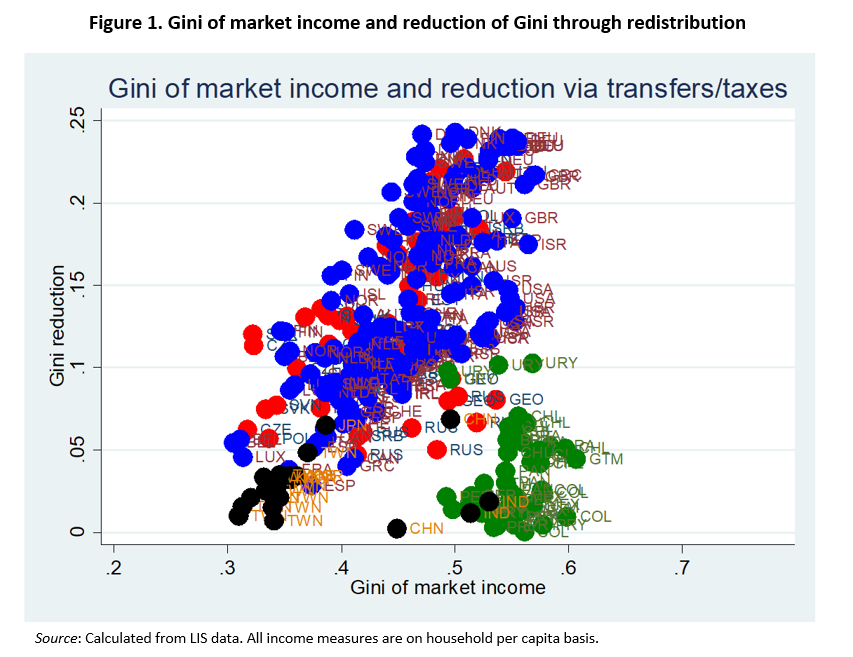
Latin American countries (in green) stand out: their market income inequality is high and their redistribution is low: β is only 0.04 and not statistically significantly different from zero. LAC countries’ market income Ginis are between 0.5 and 0.6 and redistribution shaves off on average only about 2-3 Gini points from that inequality (that is, reduces Gini by 0.02 to 0.03). If Western countries had Latin American levels of market income inequality (and some indeed do), the redistribution would equal some 20 to 25 Gini points. Thus, the origin of high disposable income inequality in Latin America lies not only in a high level of market income inequality, but is also due to the very low level of redistribution. Latin America is indeed, in those respects, different from other regions for which we have similar data.
Non-anonymous redistribution and the role of politics
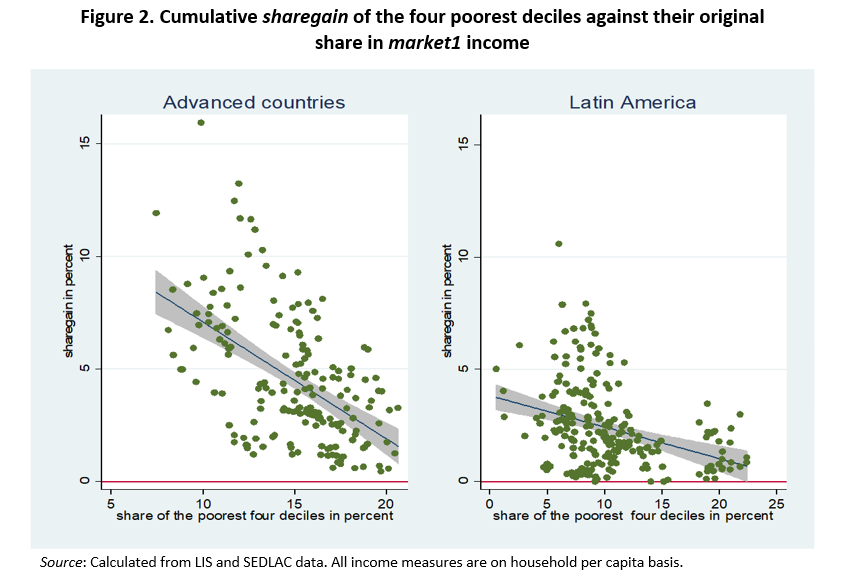
We now move to non-anonymous analysis of redistribution where we look at how the share of the bottom four deciles (according to market1 income), called “the poor”, changes through the process of redistribution. Figure 2 contrasts the results for advanced economies (Western Europe, North America, and Oceania) and Latin American countries. Each dot represents a value from one survey that shows market1 share of the poor on the horizontal axis, and the gain in income share of the same people at gross income stage, that is, through government social transfers, on the vertical axis.10 The regression line with the five-percent confidence interval is shown in both panels. The results indicate that in both sets of countries, redistribution is stronger if market1 share of the poor is lower. Redistribution reacts positively to the poverty of the bottom deciles. We therefore note that the redistribution hypothesis (higher initial inequality => greater the sharegain) holds in both regions. But the reaction to rising inequality is much weaker in Latin America where the regression line is much flatter. The level of reaction is also lower as shown by the fact that the height of the line is less in Latin American than in advanced economies.
In other words, based on non-anonymous data, we conclude that Latin American redistribution (for a given level of market1 income inequality) is less than in rich countries and that the system reacts more weakly—that is, compensates less—when market1 income inequality increases. In advanced economies, each percentage point loss in market income of the poor is “compensated” by 0.52 percentage sharegain through transfers. We call this elasticity γ. In Latin America γ is only 0.14. These are of course “crude” elasticities, not controlled for other factors. Note that γ can be interpreted as a reaction to an unanticipated negative income shock that affects the poor. The higher the elasticity, the more are government transfers able to compensate for sudden income losses. We look next at the elasticity after introducing a number of political and economic controls.
Introducing political controls
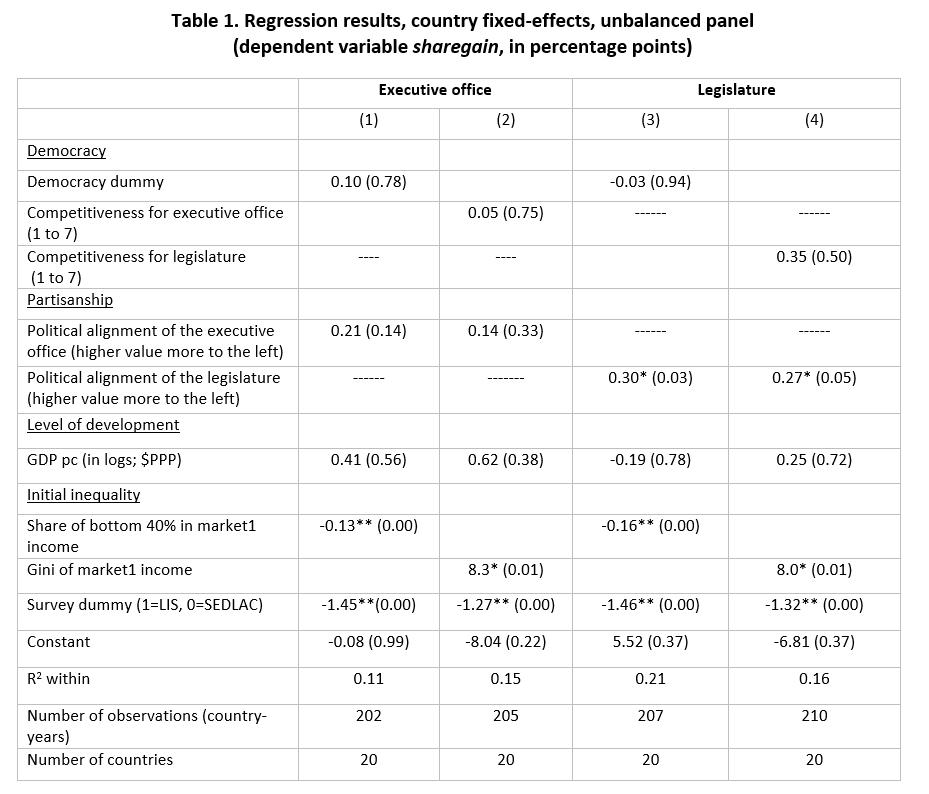
We do this by running regressions where the sharegain is the dependent variable which does not just depend on the initial market1 share of the poor but also on a number of other, mostly political, variables that might influence government redistribution. We use two specifications of the regression: one where sharegain is regressed against democracy and partisan variables that reflect the political situation at the legislative level (parliaments); GDP per capita as a proxy of development; and the original (market1) share of the poor; another specification includes the same variables except that the political variables reflect democracy and partisanship at the level of the executive branch.
Table 1 presents the results of the regressions. Democracy, both as the dummy variable and as competitiveness for the executive office or legislature, is statistically not significant. Political alignment, whether left- or right-wing is not significant as far as the executive office is concerned. However, when it comes to legislatures, left-wing parliaments are more redistributionist. Every leftward shift (whether from the right to the center, or from the center toward the left) is associated with an increased income share of the poor by about 0.3 percentage points. Given that the average sharegain of the poor in Latin America and the Caribbean is about 2.4 percentage points, it means that each pro-left swing of the legislature is responsible for about 10 percent of the poor’s gain. This is an important result showing that the connection between reduction of inequality in Latin America and left-wing political change may not be accidental. GDP per capita is not influential. What also matters are the variables linked with the redistribution hypothesis: the lower the original share of the poor, the greater the redistribution. The elasticity is quite low though. It is between 0.13 and 0.16, implying –as explained—that if a sudden economic shock were to reduce the income share of the bottom 40% of the population by 1 percentage point, that would be compensated only by between 0.13 and 0.16 percentage points.
Very similar results are retrieved in the anonymous formulation of the regressions (see regressions 2 and 4 in Table 1). where instead of the initial income share of the bottom 40% we use Gini of market1 income. Higher market income inequality is strongly associated with greater redistribution: if Gini increases by 1 point (say, from 40 to 41), the sharegain would on average increase by around 0.08 percentage points.
Conclusion
The objective of this article was to study recent decrease of income inequality in Latin America and the Caribbean while placing it within the median voter framework and actual political developments in the region. We were motivated by two questions: first, does greater market income inequality lead to greater redistribution through social transfers?; and second, are leftist political parties more redistributionist? The answer to both questions is “yes”.
Like in other regions, we find very strong evidence in Latin America that greater market inequality is associated with what may be called “automatic income stabilizers” that provide some compensation to the poor for their lower market income. These automatic income stabilizers in Latin America are much weaker and less reactive to the loss of market income among the poor than are similar stabilizers in Western countries and Eastern Europe, or to the extent that we can tell (given sparse data) in Asia. Thus we find that Latin America differs from other regions in the world because it has very high market income inequality and modest social transfers.
Regarding our second question, we find evidence that more leftist parties when they control national parliaments are associated with greater pro-poor redistribution. (We do not find however that the same effect holds for leftist presidents.) This is an important finding because it shows that the pro-left political swing in the early 2000s and the reduction of LAC inequality were unlikely to have been independent events. There might have been political roots to the recent decrease of Latin American inequality. While we obviously cannot prove causality, nor can affirm that it was the left-wing swing that led to the reduction in inequality (as opposed to say, reduction of inequality leading to the vote for more leftist parties), we believe that retrieving this result empirically, from the data covering 20 countries, 35 years, and coming from more than 200 surveys, may be relevant for policy-making not only in Latin America but elsewhere.
1LIS definitions are as follows: Market income (MI), brutto market income = brutto earnings (inclusive of wage taxes) + income from self-employment + cash property income + occupational pensions. Gross income = brutto market income + all social transfers + regular private transfers (state mandated alimony and others private transfers). Disposable income = Gross income – mandatory payroll tax – direct income taxes. For SEDLAC data, the definitions are as follows: Market income (MI), net market income = net earnings + income from self-employment + cash property income. Gross income = net market income + non-retirement social transfers + private transfers. Disposable income = gross income. (We use the term “brutto” here to differentiate between the situation when wage taxes are included as part of wages from the term of “gross” income that is used by LIS and more generally in work on household surveys.) Note for this analysis we assume that pensions are part of market income, in other words we treat them as deferred wages (for further elaboration see forthcoming paper). Market income that includes state pensions (specifically in the LIS nomenclature, state old age and survivors’ benefits) is called market1 income. This is the concept we shall use throughout. In all cases we work with household-per-capita definitions where deciles are composed of 10 percent of individuals whose income is their household per capita income.
2The most democratic situation is when both electoral competitiveness are at the maximum, that is both take the value of 7. For political alignment we use the variable that proxies the political tendencies (right, center, left) of the executive and the legislature.9 9 The variables are gov1rlc = political orientation of the largest party in legislature, and execrlc = chief executive political party’s orientation.
References
| Alvaredo, Facundo and Leonardo Gasparini (2013), “Recent trends in poverty and inequality in developing countries”, Universidad Nacional de la Plata, Documento de Trabajo No. 151, November 2013. Available at http://sedici.unlp.edu.ar/handle/10915/49154. |
| Beck, Thorsten; George Clarke; Alberto Groff; Philip Keefer; Patrick Walsh (2001), New Tools in Comparative Political Economy: The Database of Political Institutions. Washington, DC: World Bank. . |
| Ferreira, Francisco, Philippe Leita and Julie Litchfield (2007), “The rise and fall of Brazilian inequality, 1982-2004”,Macroeconomic Dynamics, pp. 1-32. |
| Gasparini, Leonardo, Guillermo Cruces and Leopoldo Tornarolli (2011), “Recent Trends in Income Inequality in Latin America”, including comments by Daniel Mejía and Daniel E. Ortega, Economia: Journal of the Latin American and Caribbean Economic Association, vol. 11 (2), Spring, 147–201 |
| Keefer, Philip and Branko Milanovic (2014), “Party age and party color : new results on the political economy of redistribution and inequality”, World Bank Working Paper No. 7129, December. |
| Luxembourg Income Study (LIS) Database,http://www.lisdatacenter.org (multiple countries; {August 2018 to March 2019}). Luxembourg: LIS. |
| Meltzer, Allan. H. and Richard, Scott F. (1981), “A rational theory of the size of government”, Journal of Political Economy, vol. 89, 914-927. |
| Meltzer, Allan. H. and Richard, Scott F. (1983), “Tests of a rational theory of size of government”. Public Choice, vol. 41, 403-437. |
| Milanovic, Branko (2000), “The median voter hypothesis, income inequality and income redistribution: An empirical test with the required data¨, European Journal of Political Economy, vol. 16, 367-410. |
| Tornarolli, Leopoldo, Mattias Ciaschi and Luciana Galeano (2018), “Income distribution in Latin America. The Evolution in the last 20 years: A global approach”, SEDLAC, Documento de Trabajo 234, September |