Issue, No.8 (December 2018)
Inequality and Unfairness in Europe
Introduction
As frequent readers of this newsletter are aware, economic inequality has become one of the most prominent topics in public discourse among academics, policymakers and the general public. Typically, these debates are informed by longitudinal or cross-country comparisons with respect to some aggregate measure of economic inequality. For example, in recent academic and policy contributions the authors from the World Inequality Report raise red flags with respect to the current increase in inequality by drawing on long-term comparisons both within and between countries using top (income/wealth) shares as measures of inequality.
Such comparisons are important in their own right. Yet, they are less informative when it comes to the question of distributive justice. In many of these contributions the underlying normative assumption seems to be that less inequality is always better than more. Taking this presumption to its logical conclusion, the ideal outcome in income distribution would be perfect equality. Perfect equality, however, seems hardly defensible either from an efficiency or from a moral perspective. To be sure, there are many potential reasons why inequality is not morally justifiable. However, there are also many reasons why some measure of inequality may be defensible. Everything else being equal, would we really want to redistribute income from A to B if all of their income differential is due to the fact that A works long hours while B privileges leisure over work? If not, it is clear that perfect equality is a misleading reference point when discussing the fairness of a given income distribution.
With hidden normative assumptions abounding in public discourse on inequality, an explicit discussion of what it means to live in a society with a fair distribution of income is surprisingly wanting. Is the current income distribution in Denmark more just than the one in Germany? Has the US become more unfair since the golden age of the welfare state in the aftermath of World War II? Such questions cannot be answered by simple comparisons of aggregate inequality measures such as the Gini coefficient. Instead, it is more useful to pose the question of why we think that inequality is unfair in the first place. Once equipped with an explicitly normative conception, it might be possible to evaluate income distributions from a perspective of fairness. In Hufe et al. (2018) we advance this agenda by proposing the first set of inequality measures that is sensitive to three widely accepted fairness concerns at the same time: (a) freedom from poverty, (b) freedom from affluence, and (c) equality of opportunity.
We want to use this short article, which is based on Hufe and Peichl (2018), to showcase our method and illustrate the importance of reconciling different fairness concerns into one combined measure of unfair inequality. In fact, we will show that standard measures of overall inequality, such as the Gini index, are indeed positively correlated with measures of each of these principles of fairness. Yet country rankings may be markedly different depending on which fairness principle we invoke. For example, while some countries perform well in reducing poverty, others perform well in the dimension of opportunity equalization. Hence, to assess whether a given level of inequality is morally objectionable, it is important to reflect the multiplicity of ideals of fairness in the inequality measures used.
Data
To illustrate these suggested aspects of unfairness, we draw on the EU Statistics on Income and Living Conditions (EU-SILC) which covers 31 European countries. EU-SILC is a well-researched database for monitoring inequality, poverty, and social exclusion in Europe which allows for easy comparison of our results with previous works. We consider households to be poor if their household income falls short of the so called European at-risk-of-poverty rate, which is set at 60% of the country-specific median equivalized disposable household income. To be categorized as affluent, households must dispose of at least 400% of the median income.
We speak of an unequal distribution of opportunities if we detect income differences based on characteristics that are beyond the control of individuals. In particular, we use four background variables: the biological sex, the migration background, as well as the educational status and occupation status of the parents of individuals1. The stronger the dependence of household incomes on these characteristics, the higher the level of inequality of opportunity.
To briefly summarize the data: In 2010, mean disposable household income was the lowest in Romania, Bulgaria and Lithuania (µ < €5,000). At the top of the intra-European country distribution, we find Luxembourg, Norway and Switzerland, where average disposable household income hovers around the €40,000 mark. In all countries in our sample, income distributions are skewed to the right, i.e. the median income lies below the country average. Not surprisingly, incomes are most equally distributed in the Nordic countries. Frontrunner Norway features a Gini score of 0.221, whereas Bulgaria and Lithuania are characterized by a very unequal income distribution, only topped by Latvia with a measure of 0.353.
Unfairness and inequality
As outlined in section 1, demands for full equality are hard to justify. Consequently, comparisons based on inequality measures may be misleading when it comes to the evaluation of income distributions from a fairness perspective. That is why we now turn to three different aspects of inequality that could raise normative concerns: (a) poverty, (b) affluence, and (c) inequality of opportunity.
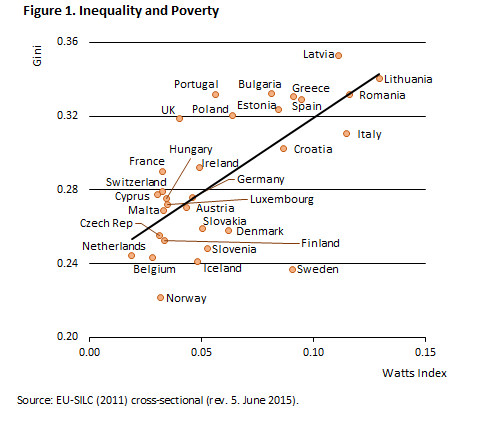
(a) Poverty. First, we consider individual deprivation, i.e. the concern that some do not have sufficient means to make ends meet. Typically, poverty is calculated by partitioning the population into a poor and a non-poor fraction by means of a poverty line. Then, an aggregation index is applied to summarize income distribution below the poverty line. The higher the poverty index, the more unfair the income distribution from the perspective of those who are poverty-averse. To characterize the lower end of income distributions we draw on the Watts index that increases with (i) the overall number of the poor, (ii) their average shortfall from the poverty line, and (iii) inequality within the poor faction of the population (Zheng, 1993).
As illustrated in Figure 1, the Watts index of poverty is positively correlated with total inequality as measured by the Gini index (ρ=0.686). Yet, the positive correlation hides a more nuanced picture. Consider the cases of the United Kingdom (UK) and Poland (PL). With a Gini index of approximately 0.320 both are on a par in terms of aggregate inequality. Does this imply that both countries are also on a par from a fairness perspective? Certainly not if fairness accommodates poverty aversion. According to the Watts index, poverty levels in Poland exceed their UK analogues by a long way. Hence, evaluating the income distribution of those two countries by reference to aggregate inequality may be grossly misleading if we uphold that inequality is particularly concerning to the extent that the poor do not have enough to make ends meet.
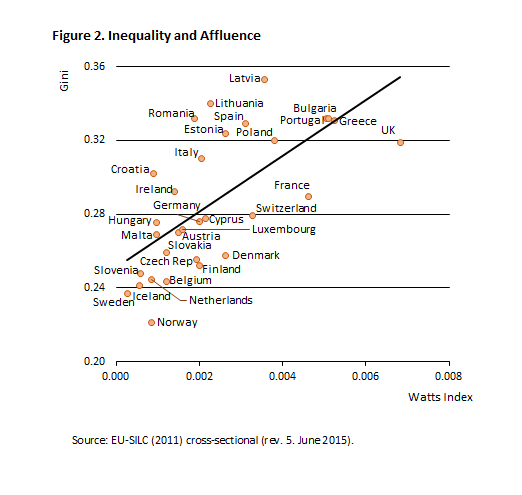
(b) Affluence. Second, we consider individual affluence, i.e. the concern that some have so much that they could tilt the balance of social processes in their favor. In analogy to poverty measurement, the population is partitioned into an affluent and a non-affluent fraction by means of a richness threshold. Then, an aggregation index is applied to summarize income distribution above the richness line. The higher the richness index, the more unfair the income distribution from the perspective of those who are affluence-averse. Analogous to the measurement of poverty, we use a modified Watts index to characterize the upper end of income distributions. Rather than households below a poverty threshold it captures those whose incomes exceed a richness line and weights these incomes by means of a logarithmic transformation. In analogy to the poverty measure, the Watts richness measure is positively correlated with total inequality as measured by the Gini index (ρ=0.674). However, it is once again important to register the subtle differences in the inequality experiences of the different countries before drawing conclusions with respect to fairness. Consider again the cases of the UK and Poland which are comparable in overall inequality. In contrast to the comparison based on poverty it is now the UK that is characterized by far greater unfairness in income distribution since affluence measures in the UK exceed their analogues in Poland by a long way (Figure 2). Hence, while according to poverty-aversion we ought to prefer the income distribution of the UK to the one of Poland, affluence-aversion leads to the opposite conclusion.
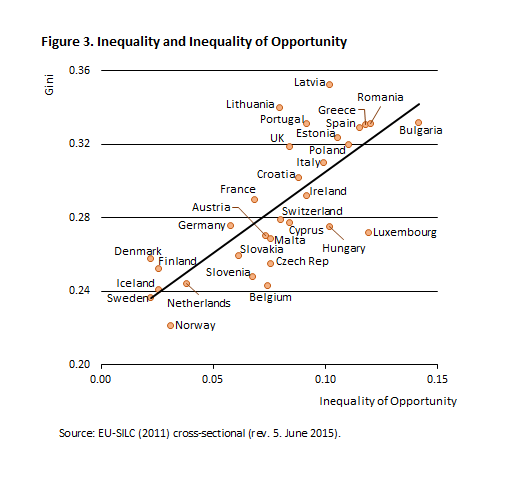
(c) Inequality of Opportunity. We now turn to the concern regarding unequal opportunities. Typically, inequality of opportunity is measured by comparing incomes across types that are defined by a set of factors beyond individual control (Hufe et al. 2017). The larger the disparities across types, the more individual incomes are determined by factors beyond individual control, the more unfair the income distribution from the perspective of an adherent of equal opportunity. For the sake of this argument, we measure inequality of opportunity by means of the ex-ante utilitarian methodology, in which we first replace the incomes of individuals by the mean income of their respective types. Types are defined by the above-mentioned background variables (biological sex, migration background, educational status and occupation status of the parents) of individuals. In a second step, we characterize inequality in this counterfactual distribution by the Gini index. This measure varies according to the following logic: The larger the average disparities due to factors beyond individual control, the larger the disparities in type and the larger the Gini index in the counterfactual distribution, and hence the larger the measure of inequality of opportunity.
The correlation of inequality of opportunity and overall inequality is shown in Figure 3. As in the previous cases, overall inequality is positively correlated with the concern for equal opportunities (ρ=0.771). However, this is not to say that opportunity egalitarians can make fairness judgements based on the comparison of overall inequality alone. For example, in spite of their comparability in overall inequality, Poland and the UK are strongly divergent in terms of their distribution of opportunities. While inequality of opportunity reaches a level of 0.084 Gini points in the UK (Rank 17), inequality of opportunity amounts to 0.110 Gini points (Rank 27) in Poland. Hence, an opportunity egalitarian would prefer the income distribution of the UK over the one in Poland.
A combined measure of unfair inequality
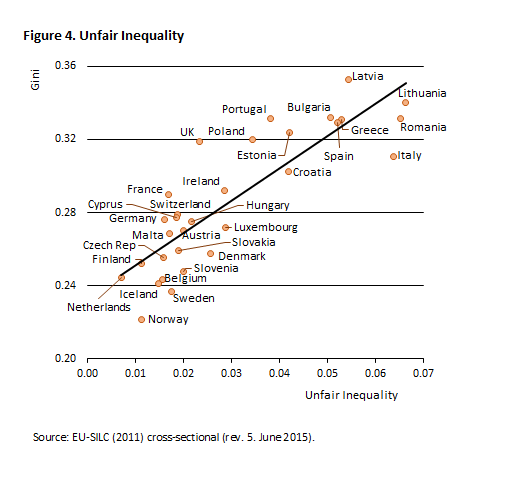
The comparison of Poland and the UK have shown how different normative considerations may yield different, even opposite, results. Therefore, empirical researchers interested in the question of fairness need to find ways to reconcile different normative concerns into aggregate measures. In Hufe et al. (2018) we propose a set of measures of unfair inequality that accomplishes this reconciliation. To construct these measures, we follow a two-step procedure. First, we create an alternative, counter-factual income distribution for the observed countries, based on the fairness principles of (a) freedom from poverty, (b) freedom from affluence, and (c) equality of opportunity. In a second step, we construct a scalar measure of unfair inequality by aggregating the differences between the fair norm distribution and the actual income distribution. A larger divergence between ideal and factual allocation thus indicates stronger violations of our three normative principles.
Figure 4 presents the results in relation to the Gini coefficient. Correlation to overall inequality is strongest with our indicator (ρ=0.852) but it paints a much more nuanced picture of (un)fairness than the aggregate measure, considering both freedom from poverty and affluence, as well as inequality of opportunity. Coming back to our example of Poland and the UK, we can see that both score better in terms of unfair inequality than expected from their Gini coefficient. However, anyone wanting to consider all of the aforementioned fairness principles at the same time would prefer the income distribution of the United Kingdom to that of Poland.
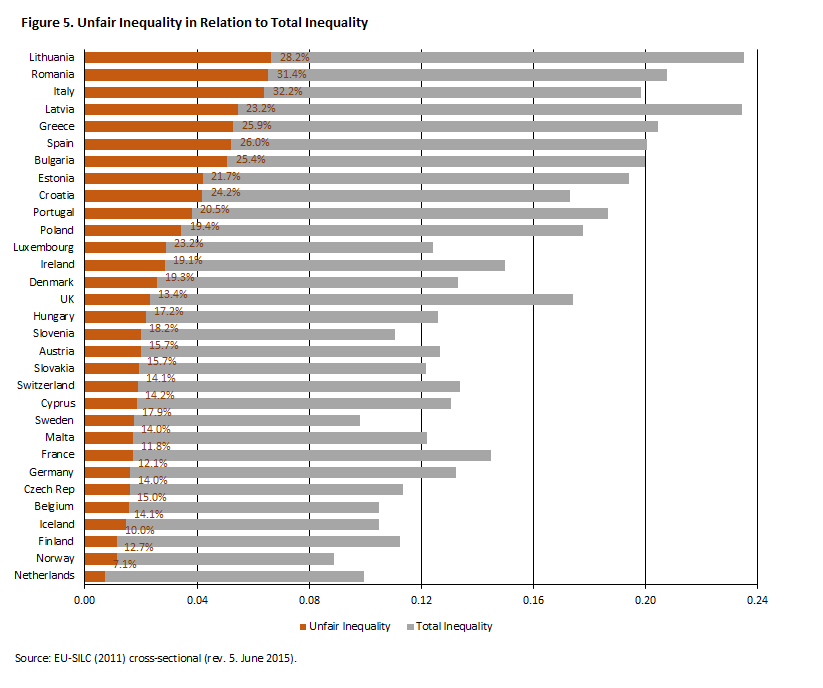
A more intuitive way to interpret our unfair inequality score is in relation to total income inequality, as measured by the mean log deviation. Figure 5 depicts our comprehensive results. The maroon bars show the extent of unfair inequality within total inequality (grey bars). In relative terms inequality is of most concern in Italy, where almost a third of all inequality is in violation of at least one of our three normative principles2.
Conclusion
We have shown that aggregate measures of inequality are imperfect proxies for fairness in a given distribution of income. While inequality correlates positively with poverty, affluence and inequality of opportunity, the correlation is far from perfect, actually leading to different country rankings depending on the chosen normative principle. For proper considerations about fairness it is thus indispensable to have a clear understanding of why we care about inequality.
Current research on fairness preferences suggests that fairness cannot be captured by referring to one normative principle only (Konow & Schwettmann, 2016). Instead it appears that fairness preferences are informed by multiple normative principles – such as freedom from poverty, freedom from affluence and equality of opportunity. Our analysis has shown that the isolated analysis of these aspects may point to different directions when comparing income distributions. It is not necessarily the case that less poverty goes hand in hand with less affluence and a more equal distribution of opportunities. Hence, the reconciliation of different normative concerns into one aggregate measure of unfair inequality may be an important step towards making more informed judgements about the moral implications of inequality in different countries at different points in time.
1 For a more detailed description and remarks on practices in setting up the data, see Hufe et al. (2018).
2 One should note that this interpretation is not neutral towards total inequality. Comparing two countries with equal extents of unfair inequality will characterize the one with less total inequality as more unfair.
References
| Hufe, P., A. Peichl, J. E. Roemer, and M. Ungerer. 2017. “Inequality of Income Acquisition: The Role of Childhood Circumstances”. Social Choice and Welfare 143 (3-4): 499-544. |
| Hufe, P., R. Kanbur, and A. Peichl. 2018. “Measuring Unfair Inequality: Reconciling Equality of Opportunity and Freedom from Poverty”. CESifo Working Paper 7119. |
| Hufe, P., and A. Peichl. 2018. “Inequality and Unfairness in Europe”, CESifo Forum 19 (2), 26–34. |
| Konow, J., and L. Schwettmann. 2016. “The Economics of Justice”. Chap. 5 in Handbook of Social Justice Theory and Research, ed. by C. Sabbagh and M. Schmitt, 83-106. New York: Springer. |
| Peichl, A., T. Schaefer, and C. Scheicher. 2010. “Measuring richness and poverty: A micro data application to Europe and Germany”. Review of Income and Wealth 56 (3): 597-619. |
| Zheng, B. 1993. “An axiomatic characterization of the Watts poverty index”. Economics Letters 42 (1): 81-86. |