Issue, No.7 (September 2018)
Rural income growth makes China more equal
China is a remarkable case for studies on growth and inequality. In May 2016, an article in The Economist shed some light on long-term trends within the last 35 years. The article concludes that [r]ising rural incomes are making China more equal. Further, this scenario is attributed to the argument of the inverted U-shaped Kuznets curve. Simon Kuznets (1955) argued that the transformation from rural to industrialised economies is strongly linked to increases in inequality at first, but then followed by an inequality reducing effect when GDP grows further. By using the LIS data, I will try to shed some light on this on the following question. Is it true that China reached its peak of inequality and actually is on a downward trend?
The argument on steep income inequality increases and recently slightly reversed trends are also supported by various scientific studies on the Chinese economy. Shi (2016) provides evidence on Gini coefficients that do suggest that inequality first sharply increased from a level below 0.3 in the early 1980s to a level of 0.491 in 20081. In the following years, the Gini stabilised and started to slightly decrease. Shi (2016) mentions various mechanisms which may have influenced this reversed trend. Not only rural-to-urban migration further increased substantially (thus reducing inequality), but also wage increases among unskilled workers recently exceeded those of skilled urban workers. The latter is particularly beneficial for migrant workers, as consequently also remittances from urban to rural areas substantially increased.
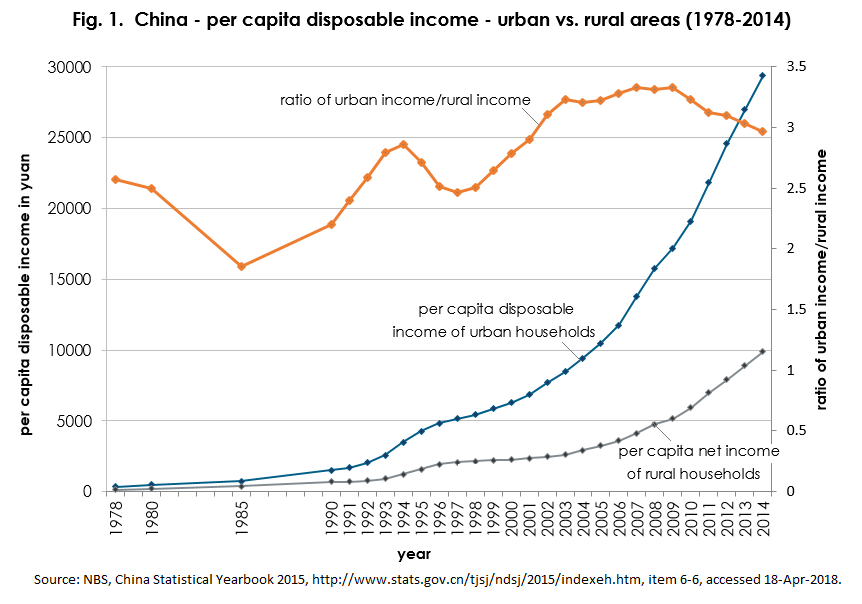
Figure 1 provides an update of Shi’s (2016) numbers – annual statistics on per capita disposable income that are released by the NBS. China’s Statistical Yearbook reports these statistics separately by urban and rural areas (shown in annual yuan on the left-hand y-axis). The numbers are also expressed as ratio between urban and rural areas (right-hand y-axis). The figure reveals that, besides the rapid increase of per capita incomes in both rural and urban China, income increases in rural areas substantially lagged behind the stronger increases in urban areas. But the ratio peaked in 2009, and started to gradually decline ever since. Zhang (2016) provides urban-to-rural ratios equally for consumption; the numbers suggest that the ratio already shows a downward trend since 2003. Concluding from these findings, yes, indeed, it seems very plausible that the trend in decreasing inequality between urban and rural areas might be well connected to an ongoing trend in decreasing Gini levels.
As these statistics are based on rather aggregated numbers, I will now extend these analyses and further break down these findings. In order to do so, I used the recently added / revised Chinese microdata from the Luxembourg Income Study (LIS) Database. So far, LIS included two waves of data from the Chinese Household Income Survey (CHIP), China 2002 and 2013, carried out by the Chinese Institute for Income Distribution (CIID) with assistance from the National Bureau of Statistics of China (NBS). Particularly, the full integration of income and expenditure variables in the China 2013 dataset has improved the consistency of these data.
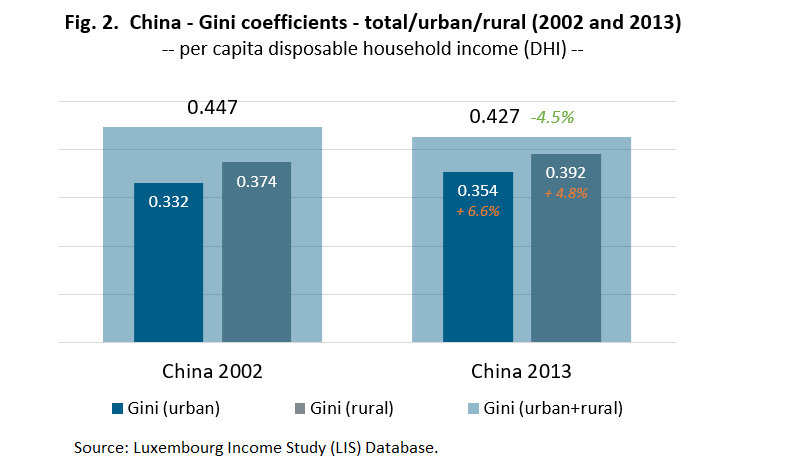
Figure 2 reports Gini coefficients for urban and rural areas separately for 2002 and 2013. It is worth mentioning that, not surprisingly, due to the high discrepancy in level of development between urban and rural areas, overall inequality exceeds significantly individual inequalities whether within urban or within rural areas. From 2002 to 2013, the overall Gini for China shows a slight decline. In contrast to this, both urban and rural areas show increases in inequality. These findings are in line with findings by Shi (2016), who (for the period 2007-2013) similarly concludes that inequality increased both within urban and within rural areas, while overall inequality went down. Particularly for rural areas this seems very plausible, given the impact of remittances to rural areas, which might have an inequality increasing effect.
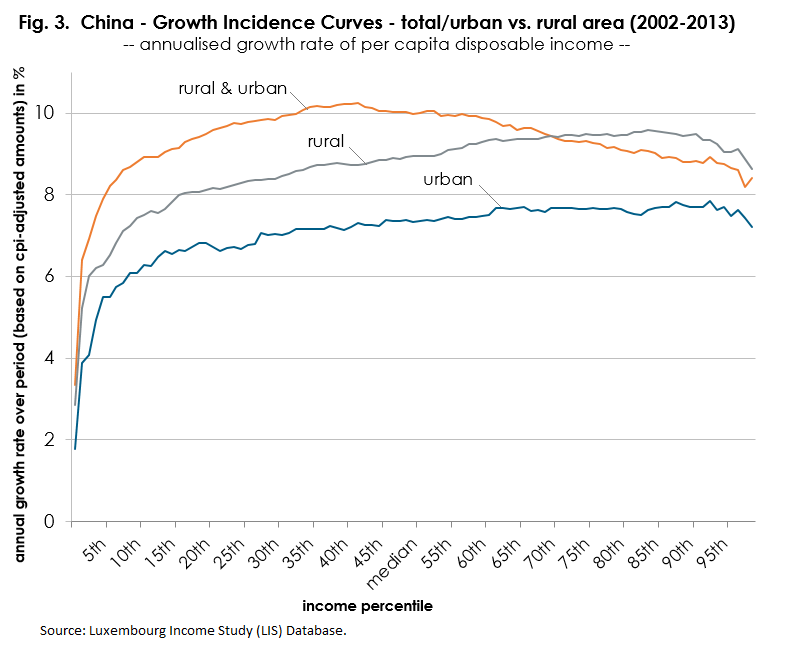
Driven by these striking findings on increasing inequality within rural and urban areas, I calculated also growth incidence curves (GICs) for the percentiles of the Chinese society (a similar exercise on the country-level (which is based on the same LIS data) has been carried out in a blogpost by Branko Milanovic earlier this year). Like Shi (2016), Milanovic attributes the strongest annualised increases in per capita income in the 30th to 60th percentiles to a pattern of higher wage increases among low-skilled labour as compared to high-skilled labour. Nonetheless, the growth incidence curves separately for rural and urban areas reveal an interesting contradictory aspect. Within both rural and urban areas, the highest growth rates over this period are to be found between the 80th to 90th percentile. Worth mentioning are also the lowest increases at the bottom of the income distribution, which mirrors the different pace of societal change and social inclusion in the Chinese society.
Last but not least, a critical note needs to be added when studying these numbers. Although the CHIP data (which are the basis for the LIS data) are considered by the research community as a fairly accessible second-best source (in contrast to the non-accessible NBS data), the data need to be interpreted with caution. Shi and Sicular (2014) acknowledge that recent developments of income growth among the rich, their underrepresentation in the sampling, and their underreporting of income may have contributed to a lower representativeness of the survey data over time, particularly among the rich. Similarly, Zhou and Song (2016) consider capital as one of the most unequal income source. The authors argue that the increase in capital income has recently been stronger than the wage increases, which pushed inequality up, but may not be fully reflected in the data. Looking at the growth rates by percentiles, which do not show a huge increase at the top, this concern is shared also in this note. At the same time, Shi and Sicular present the integration of subsamples of the NBS in the CHIP sampling design as its core strength2; although the CHIP is not sampling all Chinese provinces, the data are considered to be still representative for the whole of China.
To conclude, yes, given the recent inequality decreasing trends, there seems to be some connection between the evolution of China’s inequality and the inverted U-shaped Kuznets curve argument. However, as also summarised by a recent article by Policardo et al. (2018), this pattern needs to be seen also as reflecting increased policy efforts to alleviate poverty risk and foster inclusion. Similarly, Shi and Sicular (2014) attribute the decreases in inequality and poverty also to the strengthened policy efforts to build a more inclusive social protection for farmers.
For further interest, I recommend you to also read Kanbur et al. (2017); the scholars provide three things: First, a table-style overview of studies which analysed inequality trends in China. Second, a decomposition analysis of inequality by urban vs. rural sectors (they apply three decompositions (1) the inequality within each of the two sectors, (2) the gap between the means of the two sectoral distributions, and (3) the population share of each sector). And third, manifold other statistics which explain the “great Chinese inequality turnaround”.
1 The numbers were taken from Ravallion and Chen (2007), who calculated them using the income data from the NBS urban and rural household surveys. The Gini coefficients for 2003–14 are from NBS (2015).
2 The CHIP urban and rural survey samples are subsets of the NBS urban and rural household survey. In recent rounds, the CHIP integrated data collected by the NBS, and the CHIP collected additional information through an independent survey. Although the sampling in CHIP is not carried out in all provinces, the CHIP samples cover all of China’s major regions – applying weights, CHIP is thought to be representative for the whole of China (see more in detail Shi and Sicular (2014)).
References
| Kanbur, R.; Wang, Y.; Zhang, X. (2017), The Great Chinese Inequality Turnaround, BOFIT Discussion Paper No. 6/2017, Available at SSRN: https://ssrn.com/abstract=2962268. |
| Kuznets, S. (1955), ”Economic Growth and Income Inequality”, The American Economic Review, 45 (1), pp. 1-28. |
| Policardo, L.; Punzo L. F. ; Sanchez Carrera, E. J. (2018), Unsustainable inequality? Empirical evidence for Latin American countries, Inequality Matters, LIS newsletter, Issue No. 6 (June 2018), pp. 1-3. |
| Ravallion, M. and Chen, S. (2007), “China’s (uneven) progress against poverty.” Journal of Development Economics, 82(1), pp. 1–42. |
| Shi, L. (2016), Recent changes in income inequality in China. in World Social Science Report 2016 | Challenging Inequalities: Pathways to a Just World, International Social Science Council (ISSC), the Institute of Development Studies (IDS) and UNESCO, UNESCO Publishing, pp. 84-88. |
| Shi L. and Sicular, T. (2014), “The Distribution of Household Income in China: Inequality, Poverty and Policies”, The China Quarterly, 217, pp. 1-41. |
| Zhang, Y. (2016), Urbanization, Inequality, and Poverty in the People’s Republic of China, ADBI Working Paper No. 584, Asian Development Bank Institute. |
| Zhou, Y. and Song, L. (2016), “Income inequality in China: Causes and Policy Responses”, China Economic Journal, 9(2), pp. 186-208. |