Issue, No.4 (December 2017)
A snapshot of selected LIS Wave IX indicators
With the end of 2017, LIS Wave IX (data with income reference period centered around the year 2013) has come near to its completion. This note reviews a few indicators of poverty and inequality for all the countries for which Wave IX data are now available.
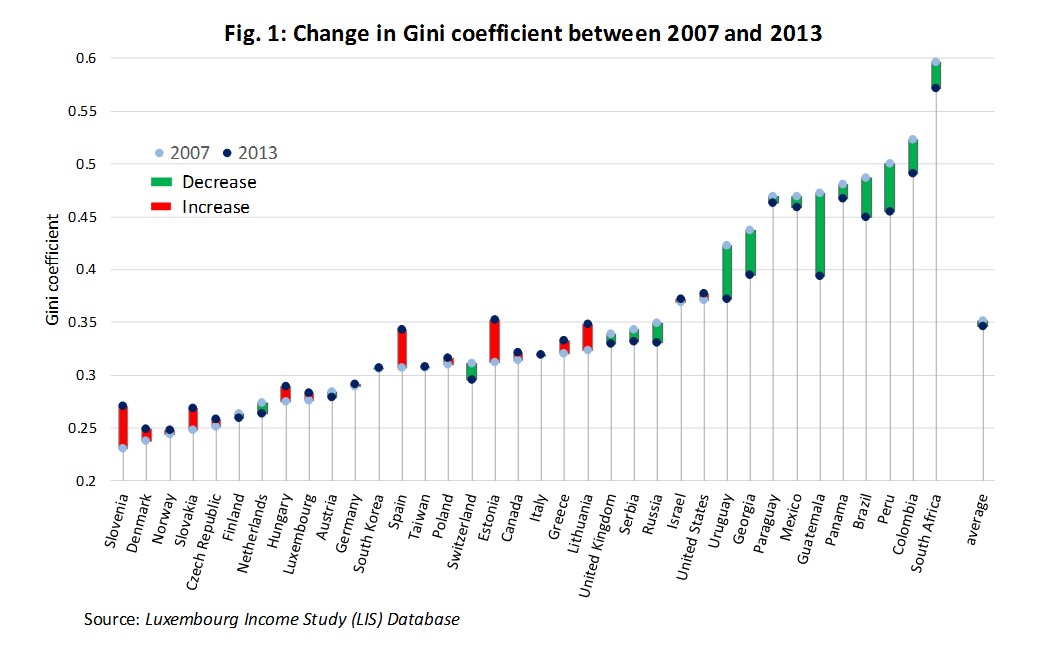
Figure 1 presents the variation in Gini coefficient in all the LIS countries for which there are data available for both Waves IX and VII (with the exception of Georgia, Lithuania and Paraguay for which the earlier data point refers to Wave VIII). Over this period, which coincided for many LIS countries with the period of the financial crisis 2007/08 and its subsequent recovery, there was little change in inequality for the whole group of countries taken together. However, when looking at the individual countries, there seems to be a rather clear pattern of increasing inequality in countries where inequality was low (or below average) to start with, and decreasing inequality in the countries where it was rather high (all middle income countries, including mostly Latin America, Georgia and notably South Africa); this seems to imply an overall convergence of inequality. The exceptions to this pattern are, on one side, Switzerland and especially the Netherlands, with low and decreasing Gini indices, and on the other side the United States, which is the only country with a higher than average Gini index, which has experienced a further increase in inequality over the period in consideration. Various other countries seem to be following the US example. Spain, Estonia and Lithuania show large increases of inequality over the period in consideration reaching the level close to the average of this country group (0.35).
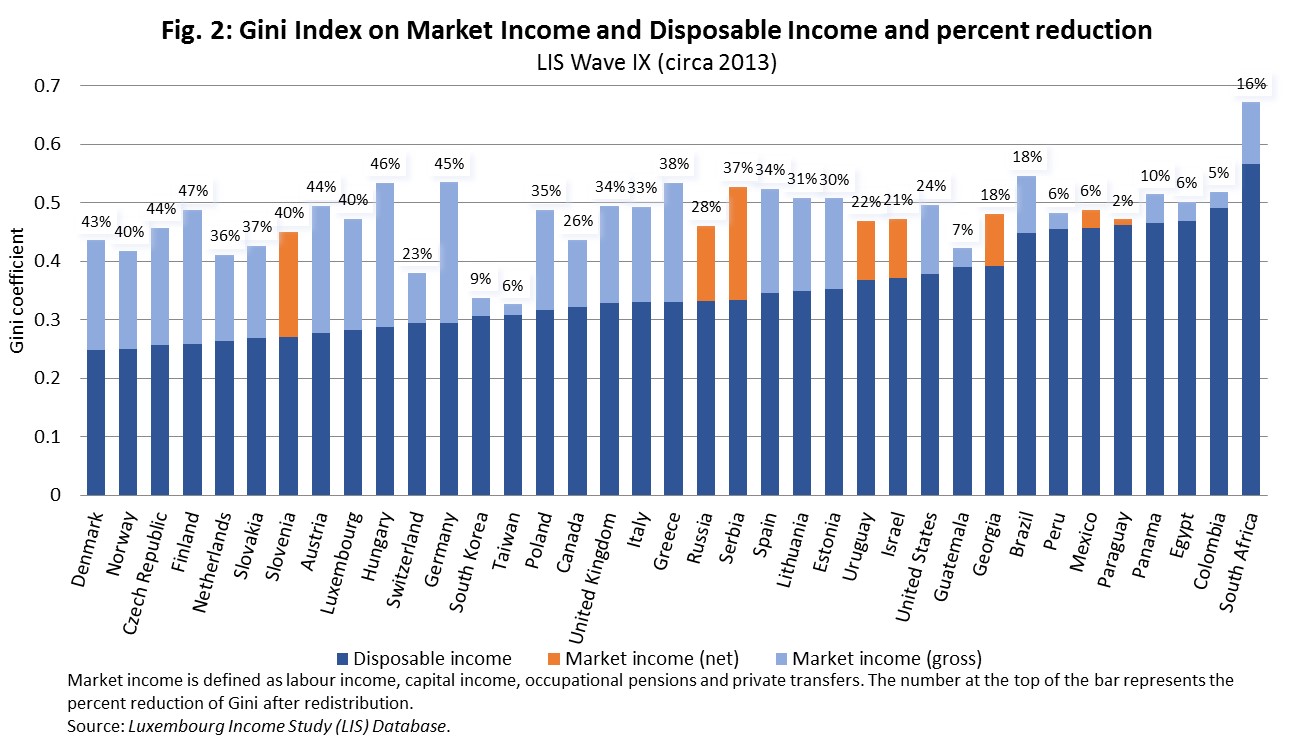
For the same country group, we are now taking a closer look on the impact of the state redistribution on inequality. In Figure 2 the impact of the redistribution is measured as the difference in Gini index when measured on market income (defined as labour earnings plus capital income, private transfers and occupational pensions) versus disposable income (hence when social security transfers and taxes are taken into account). The picture is a rather standard one, where countries with more developed public redistributive systems (typically the richer ones) exhibit higher reductions in Gini index (above 0.30 in most of them), while countries with less developed system exhibit much smaller reductions. Switzerland, Taiwan and South Korea are the three big outliers, as they achieve low inequality through a rather equal primary distribution rather than through the redistribution of social security and tax systems.
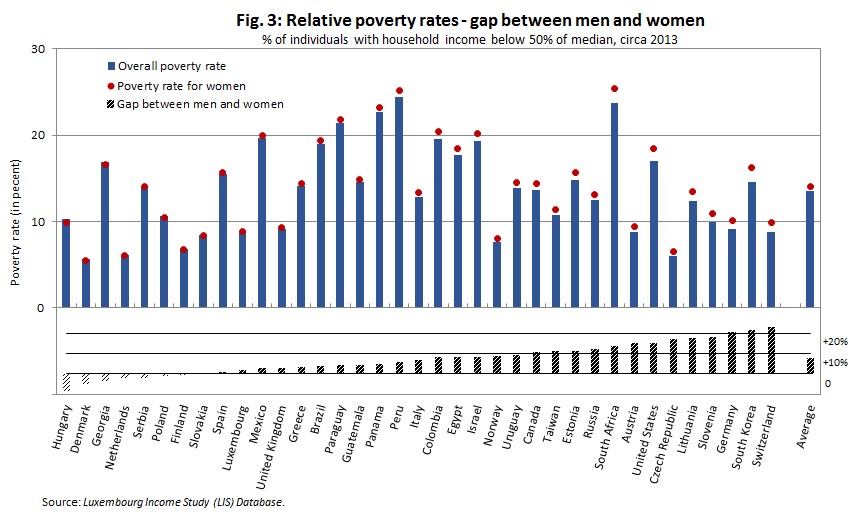
The last figure presents relative poverty rates, with a special focus on the gap between men and women. The gap is defined as the difference between women’s and men’s poverty rate in percent. A positive gap means a higher risk of poverty for women. The countries are ranked in increasing size of the gap, and it is immediately obvious that there is no clear link between the gap and the level of the overall poverty rate itself. While on average in LIS countries women’s poverty rates are 8 per cent higher than men’s rates, this gap goes up to above 15 per cent in many countries, all high income countries, some of which with very low overall poverty rates. In particular, Germany, South Korea and Switzerland have gaps of above 20 per cent: while in South Korea and Switzerland, this high women’s poverty rate can in large part be explained by very high elderly poverty rates, as a substantial share of elderly women live alone. The situation is less obvious for a country like Germany, where the elderly poverty rate is lower than the overall one.