Issue, No.3 (September 2017)
Are more children growing poor in developed countries? Evidence from the LIS Database 2000-2013
Poverty is a multidimensional phenomenon that affects all facets of people’s lives. It deprives people in many aspects (i.e.: lack of basic necessities of life, deny people of choices and of opportunities for a better life, or better acceptable life opportunities, prevent people from knowledge and communication). Considerable attention has been drawn to studying child poverty in particular; this interest has evolved from the fact that child poverty affects their current health, education, and nutrition status. Combined with lower education level attained, lower skills acquired and fragile expected work productivity, the likelihood of further transmitting poverty from one generation to the next seems rather high.
According to a recent UNICEF briefing note “Ending Extreme Poverty: a focus on children”, children were found twice as likely to be living in extreme poverty compared to adults, using the $1.90 a day poverty line, 19.5 percent of children in developing countries were living in poor household compared to 9.2% of adults, the same conclusion remained robust upon using different levels of poverty lines (e.g. $3.10..etc.) (UNICEF, 2016).
While most of poor children are located in developing countries mainly Sub-Saharan Africa followed by South Asia, it was indicated in the UNDP SDGs briefing note “No poverty: why it matters” that also, surprisingly, 30 million children are growing up poor in the world’s richest countries. Inspired by this remarkable statistic, this article is an attempt to first monitor the evolvement of poverty level of households with children (HwC) in developed countries from 2000 to 2013 and then to investigate the link between the coverage rate of the social security protection system, mainly family and child transfers, offered to households with children and their poverty levels.
Although poverty analysis is better carried out using relative measures along the direct deprivation measures, to capture all the multi-dimensional angles of the phenomenon, in this article a single relative poverty measure is used, due to data availability, as the LIS Database does currently not cover material deprivation. Consequently, a household with children is considered poor if its annual equivalised disposable income is less than 50% of the median of the national annual equivalised disposable household income (DHI).
In order to explore the link between child benefits coverage and the households with children poverty level, we will accommodate one indicator listed under target 1.3 of the SDG goal1 , which is the ratio of households receiving children benefits to the total number of households with children. However, developed countries differ in the social security system adopted. Therefore, these benefits could be universal, means-tested, or insurance-based; each type of these benefits are grouped together in the LIS Database and respectively split in maternity/parental wage-replacement, family/child universal benefits, and family/maternity/child assistance. In this article, we will not focus on the relevance of each subcategory, but rather focus on the joint coverage with any family-related program. Thus, in the following, the LIS variable hmiatfam: family/children transfers2 will be used. This will expand the SDG indicator scope to include any family/child benefits the household has received.
The unit of analysis used is households with children (HwC), without adjusting for the number of children living in these households. This approach was valued the most suitable, to enable assessing the poverty rates of these households in accordance with family benefits coverage which is calculated on the household level3 . Besides, child poverty rate is intrinsically derived from the poverty rate for households with children, which is a relative poverty measure not a direct child deprivation index.
Figure 1 addresses the main question in the article’s title, on whether more children are experiencing poverty in developed countries’ households or not. The time period for this analysis covers the development between circa 2000 and 2013. The figure shows that the poverty rates for households with children have increased in 16 out of the 22 developed countries included, with an exception of six countries namely Australia, Ireland, United Kingdom, Netherlands, Czech Republic, and Poland, where the HwC poverty rates have declined. The observed increase in poverty rates does not occur in the same pattern among the countries; for Denmark, Finland, Switzerland, Estonia and Slovakia, the increase is less than one percentage point, while the highest increase can be seen in the Mediterranean countries. The HwC poverty rate in Spain jumped from 14 % in 2000 to 21% in 2013, indicating that one out of five households with children is experiencing poverty. It is also worth noting that poverty among households with children (21.4 %) is substantially higher than the national household poverty rate (14.8%), a similar pattern is detected in Italy and Greece with increasing poverty rates for households with children over time; which is also higher than the national average. For the exceptional six countries that showed decreasing levels of the indicator over time, the reduction in percentage points differs across the countries. Tangible decrease in Ireland and United Kingdom with approximately 4, 5 percentage points respectively, compared to around one percentage point in Czech Republic, Poland, and Australia.
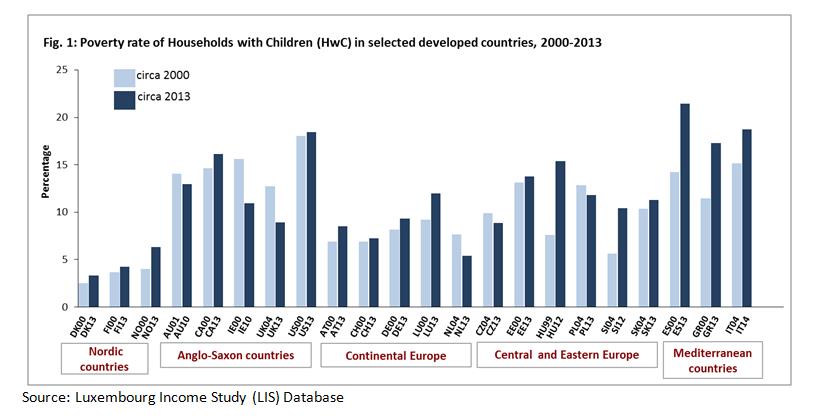
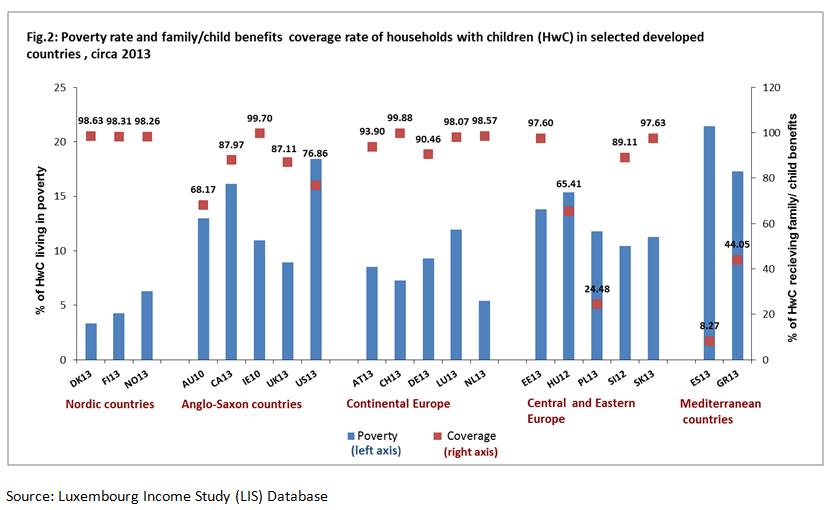
Figure 2 compares the family/child benefits coverage rates with the poverty rates for households with children circa 2013 for a selected set of countries4. Overall, a strong relationship between the two is observed; with higher coverage rate, lower poverty rates are observed. In Nordic countries, where the average coverage rate is 98% we can see that the HwC poverty rate in each of the countries is among the lowest (not exceeding 6%) while for Spain with the least coverage rate (8%), the HwC poverty rate is the highest with 21%. In accordance with high coverage rates achieved In Continental Europe, and Anglo-Saxon countries (with average 96%, and 83% respectively), lower levels of HwC poverty rates can be detected. It should be noted that, going beyond coverage rates, the effectiveness of this coverage is an inevitable analysis to be considered.
The results presented indicate that the number of children living in poverty is increasing. Although this increase is not uniform among the developed countries, the alarming signs exist for almost all. There is still room for Policy makers and politicians to devise more effective and exhaustive protection programs that would help in the world’s mission to end poverty in all its forms everywhere by 2030. Eradicating child poverty should be a priority since their current suffering is the trigger to nation’s future economic deterioration.
1 For more information on SDGs and indicators, click here
2 Components and definition of dhi, hmiatfam, and the institutional information for family/child transfers for each country/year is available on LIS METadata Information System (METIS).
3 LIS key figures on child poverty can be accessed through : LIS Key Figures
4 Some countries are not included in this figure due to data availability on family/child benefits transfers.
References
| Adamson, P. (2012). Measuring child poverty: New league tables of child poverty in the world’s rich countries. |
| Economic, U. N., & Council, S. (2016). Report of the inter-agency and expert group on sustainable development goal indicators. |
| OECD Family Database; OECD (2016). CO2.2: Child poverty, Paris. |
| UNDP Sustainable Development Goals (2016). No poverty: why it matters. |
| UNICEF and WORLD BANK GROUP (2016). Ending extreme poverty: a focus on children, briefing note. |