Issue, No.38 (June 2026)
Two Decades of Income Evolution in Belgium: Regional Disparities and the Impact of Covid-19
Notwithstanding being heavily hit by the health crisis of Covid-19, Belgium seemed to have managed to maintain a stable economic situation. The first lockdown was in March 2020 and the last one in April 2021; therefore, most of 2020 and the first part of 2021 were affected by the crisis. As expected, in 2020 there was a decline in real GDP of -5.7% (source: BDA & NBB, 2022a). However, in 2021 the Belgian economy made an impressive post-pandemic recovery with annual economic growth in real GDP of 6.2% (source: BDA & NBB, 2022b). How did the disposable income of households evolve?
Given that Belgium is a federal state with regional governments and different social policies being implemented in different regions, we look separately at the three federal regions: Brussels-Capital region, Flanders, and Wallonia. Furthermore, the Belgian labour market is characterised by substantial and persistent disparities over time between the three regions, especially in terms of unemployment (Duprez et al., 2019; OECD, 2022). The region with the highest GDP per capita is the Brussels region, followed by Flanders (OECD, 2022). However, as we can see from Fig. 1 below, the region with the highest disposable household income (dhi) is by far the Flemish region in all years. This could be explained by the large share of commuters living in other regions, especially Flanders, and working in the Capital region (Strale, 2019).
Fig. 1: Evolution of disposable household income (dhi) by region over time: 2004–2024
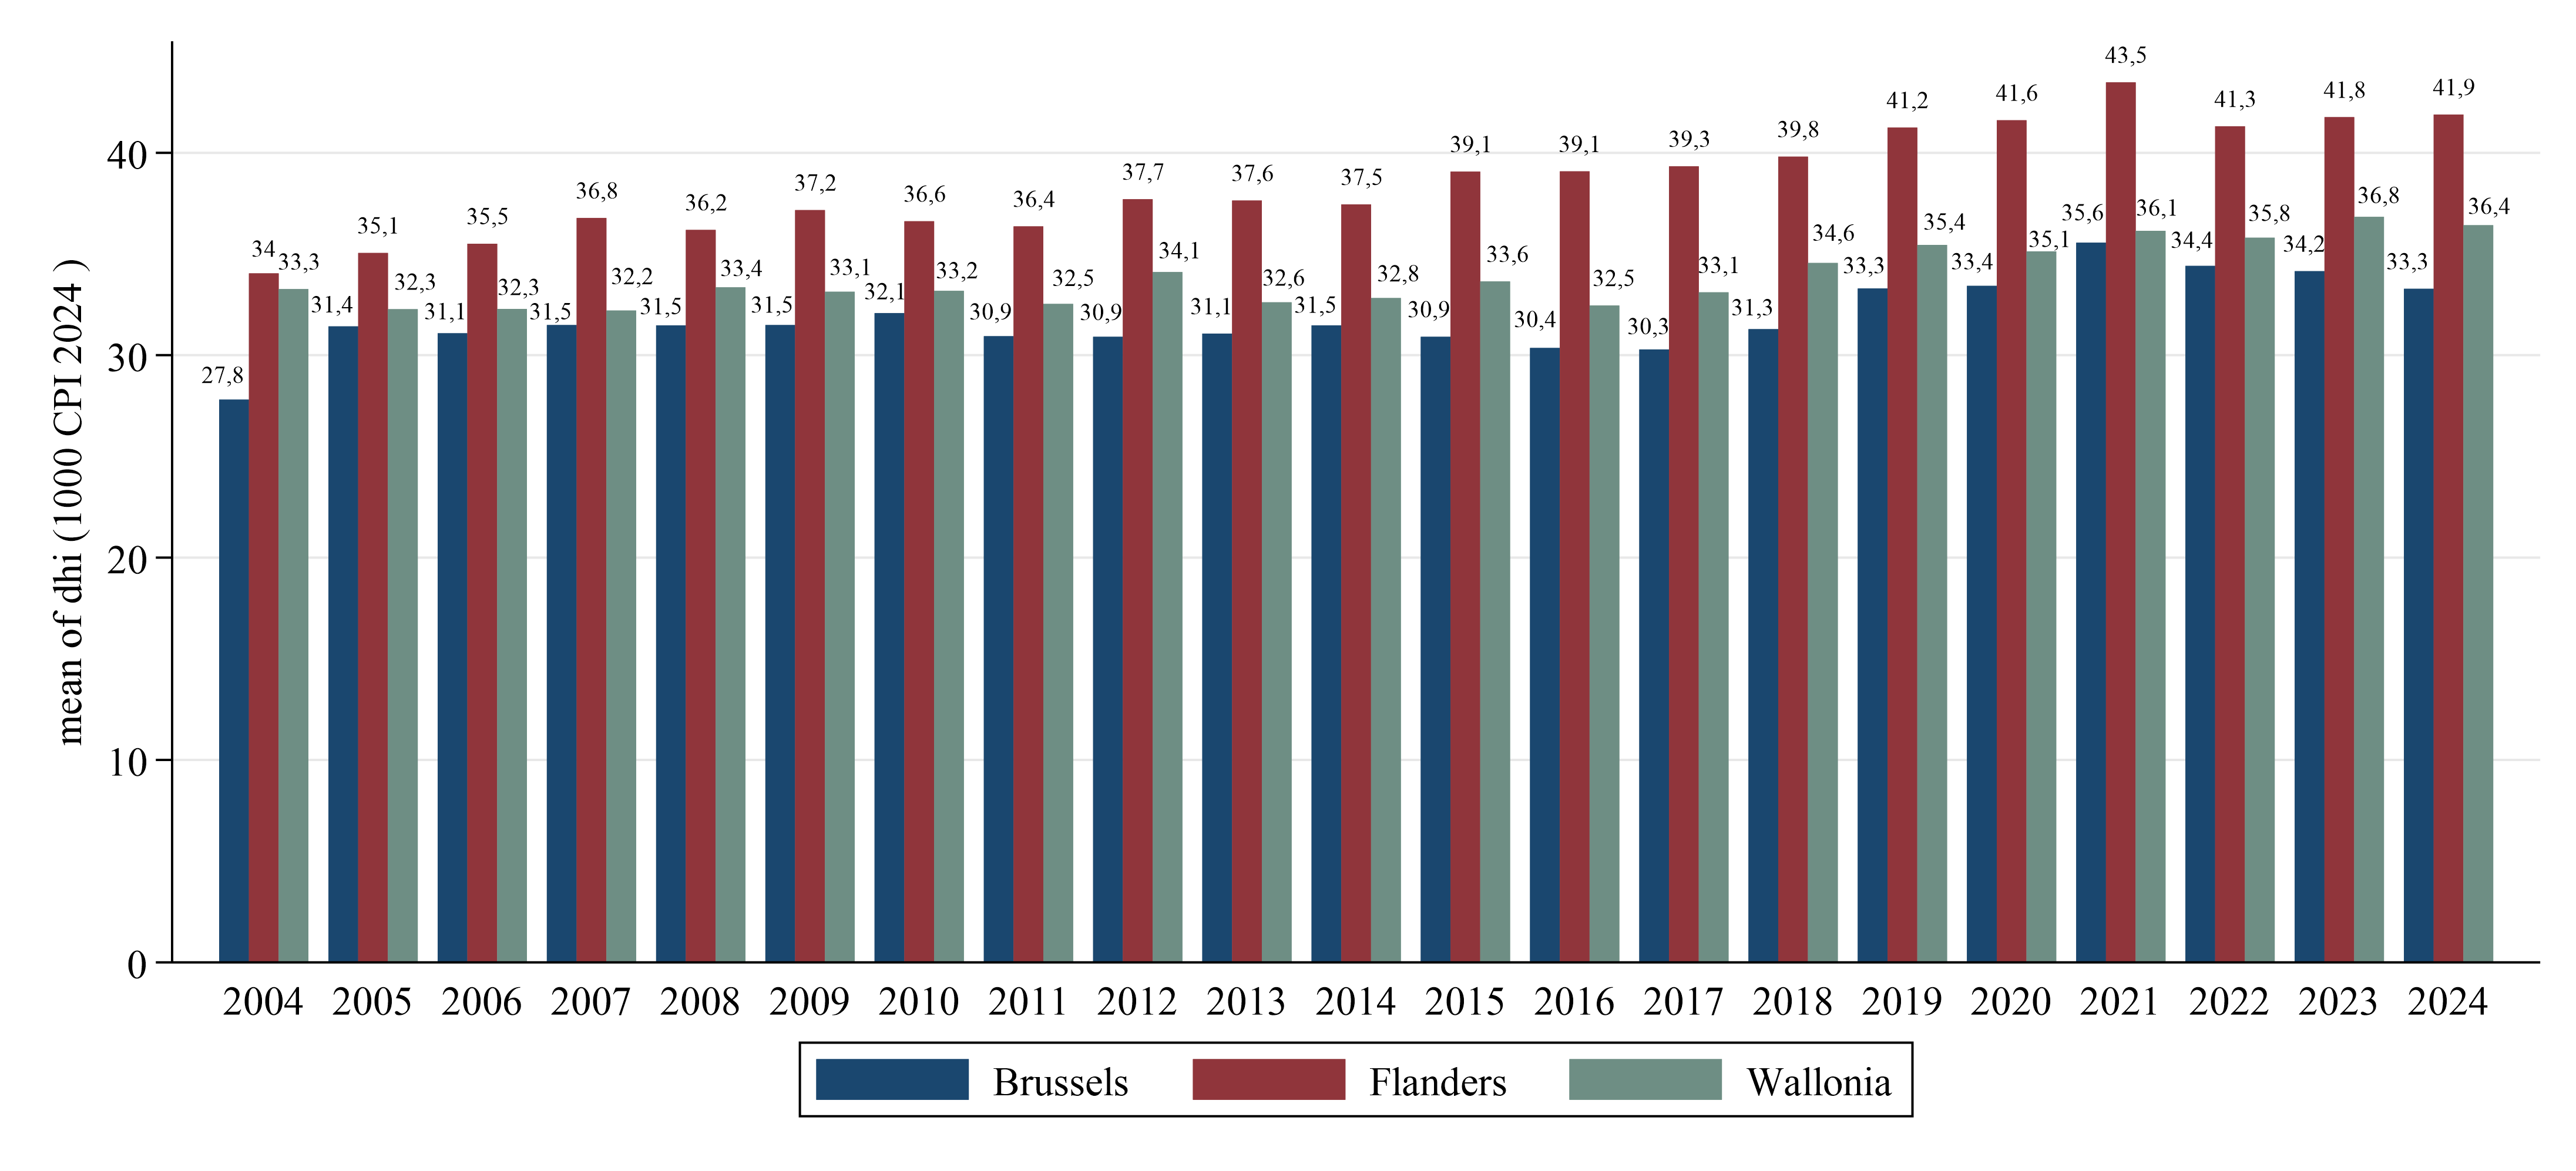
Note: Disposable household income (dhi) is calculated as the sum of all regular incomes minus taxes and contributions. The value was equivalised by the square root of household members and bottom-coded (with negative values set to 0) and top-coded (at 10× the median). It is expressed in 1,000 EUR adjusted with the Consumer Price Index (CPI) at the 2024 price index.
Source: own calculation using Luxembourg Income Study (LIS) data.
Over the last 20 years, dhi mostly increased, though at a different pace across regions and not always in a linear way. Despite small decreases or stagnations in dhi between some years, over this long period dhi increased by 23 percent in Flanders, followed by the Brussels region with a significant increase of almost 20 percent, while in Wallonia, which has the second highest dhi, the increase was only 9.5 percent over the entire period. Contrary to what we might have expected, we observe rather a stagnation or even a slight increase at the beginning of the Covid crisis, and only between 2021 and 2022 do we observe a slight decline in dhi, mostly in Flanders with 5 percent, followed by the Brussels region with 3 percent, while for Wallonia the decrease in dhi was minimal (less than 1 percent). This was followed by a slight recovery for Wallonia and Flanders in the next year, while Brussels region continued on a descending trend and was followed by Wallonia in a slightly descending trend in 2024. This recent evolution is most likely explained by the energy crisis caused by Russia’s invasion of Ukraine in early 2022, which had a significant effect on European economies that are still heavily reliant on fossil fuels, despite efforts made towards a green energy transition (IEA, 2022).
The fact that Belgian households were not significantly affected by the health crisis in terms of income is most probably due to the measures put in place as part of the Belgian Government’s Covid strategy. Therefore, in Figure 2 we examine the evolution of social benefits during the period considered.
Fig. 2: Evolution of social benefits by region over time: 2004–2024
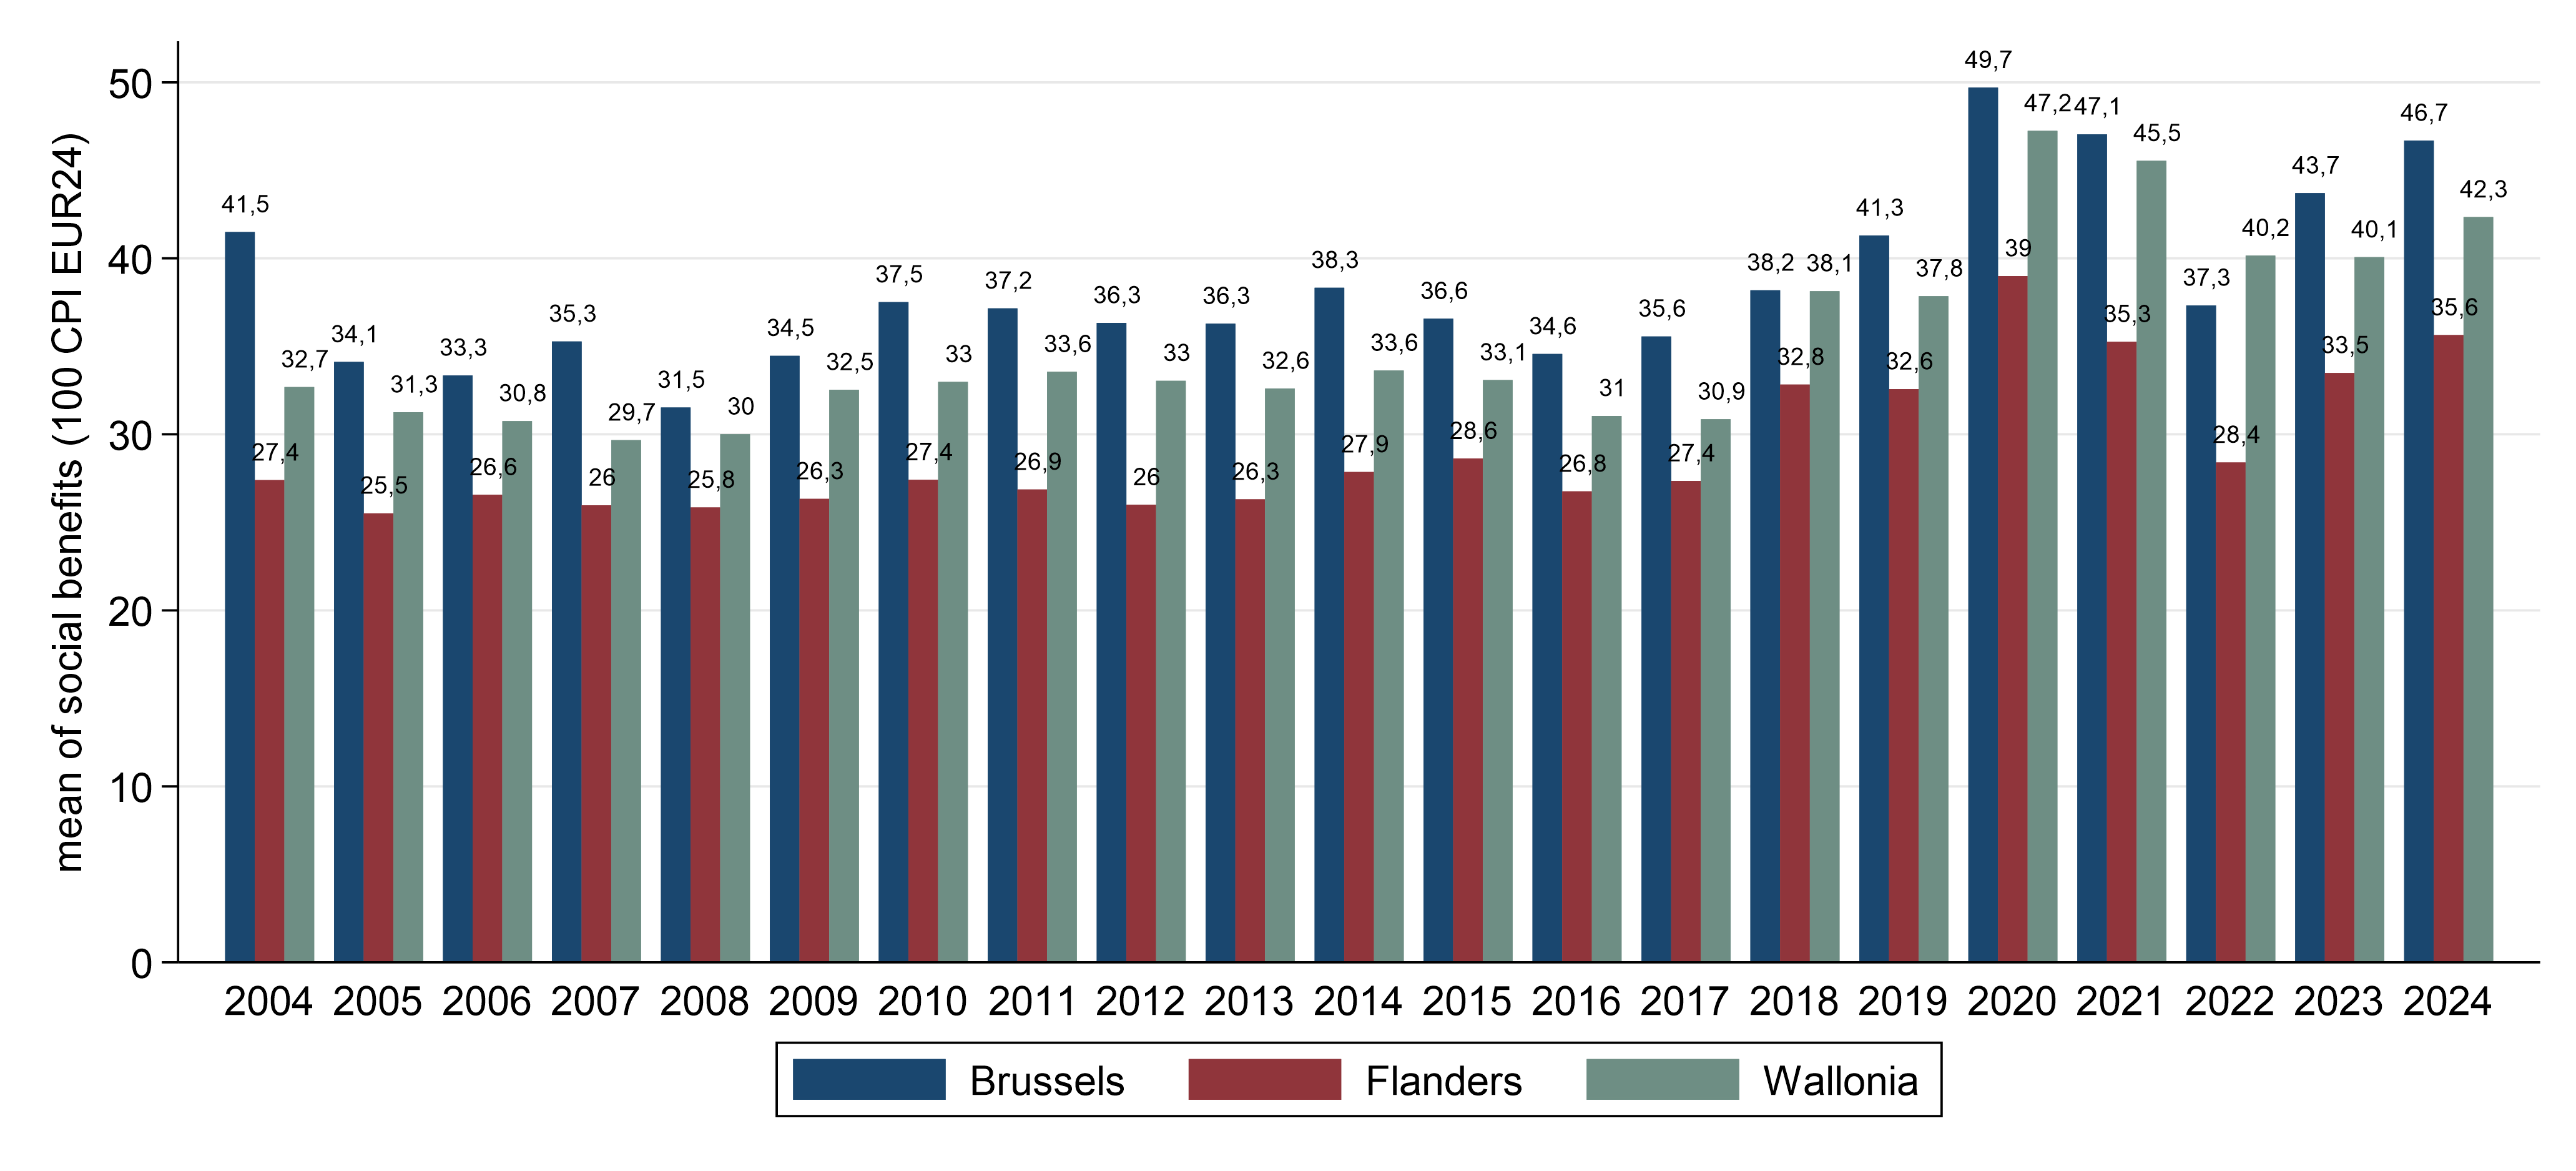
Note: Social benefits exclude contributory pensions and are equivalised (per capita, since the number of child benefits depends on the number of children, for example). Only recipients of social benefits are considered. They are expressed in 100 EUR adjusted with the CPI at the 2024 price index.
Source: own calculation using Luxembourg Income Study (LIS) data.
The evolution over time of the social benefits averaged over all beneficiaries in each region is not linear, with a significant drop in the level of benefits between 2004 and 2005, especially for the Brussels region, which has the most generous social benefits in almost all years — except immediately after the Covid crisis, when Wallonia experienced a less sharp decrease in benefits following the crisis peak.
In the first year impacted by the crisis, we observe the highest increase in social benefits in Wallonia with about 25 percentage points, followed by the Capital region and Flanders with around 20 percentage points each. In 2021, the level of benefits decreased in all regions, with a more substantial decrease in Brussels region; nevertheless, they remained above the pre-crisis level. In the following years there was an increasing trend, with social benefits becoming on average, substantially larger and/or reaching more people than even in the pre-Covid period. A contribution to this increase can be attributed to the fossil fuel subsidies that peaked in 2022 to counterbalance the energy crisis, being estimated at 2.4% of GDP (Federal Inventory of Fossil Fuel Subsidies, 2025). Although the Brussels region has the highest benefits, the gap tends to narrow over time, since the increase over the last 20 years was only 12.5 percent in the Capital region compared with around 30 percent for the other two regions.
This was accompanied by an increase in the number of beneficiaries, as illustrated in Fig. 3. During the Covid crisis, Belgium implemented special unemployment benefits for technical and partial unemployment, such as temporary unemployment and bridging payments for the self-employed, to preserve the jobs of those affected by the lockdowns (Service public fédéral Sécurité sociale, 2022). The special Covid measures reached more people in order to mitigate the labour market effects of the crisis (Coppens et al., 2021).
Fig. 3: Beneficiaries of unemployment benefits as proportion of the working population by region, 2018–2024
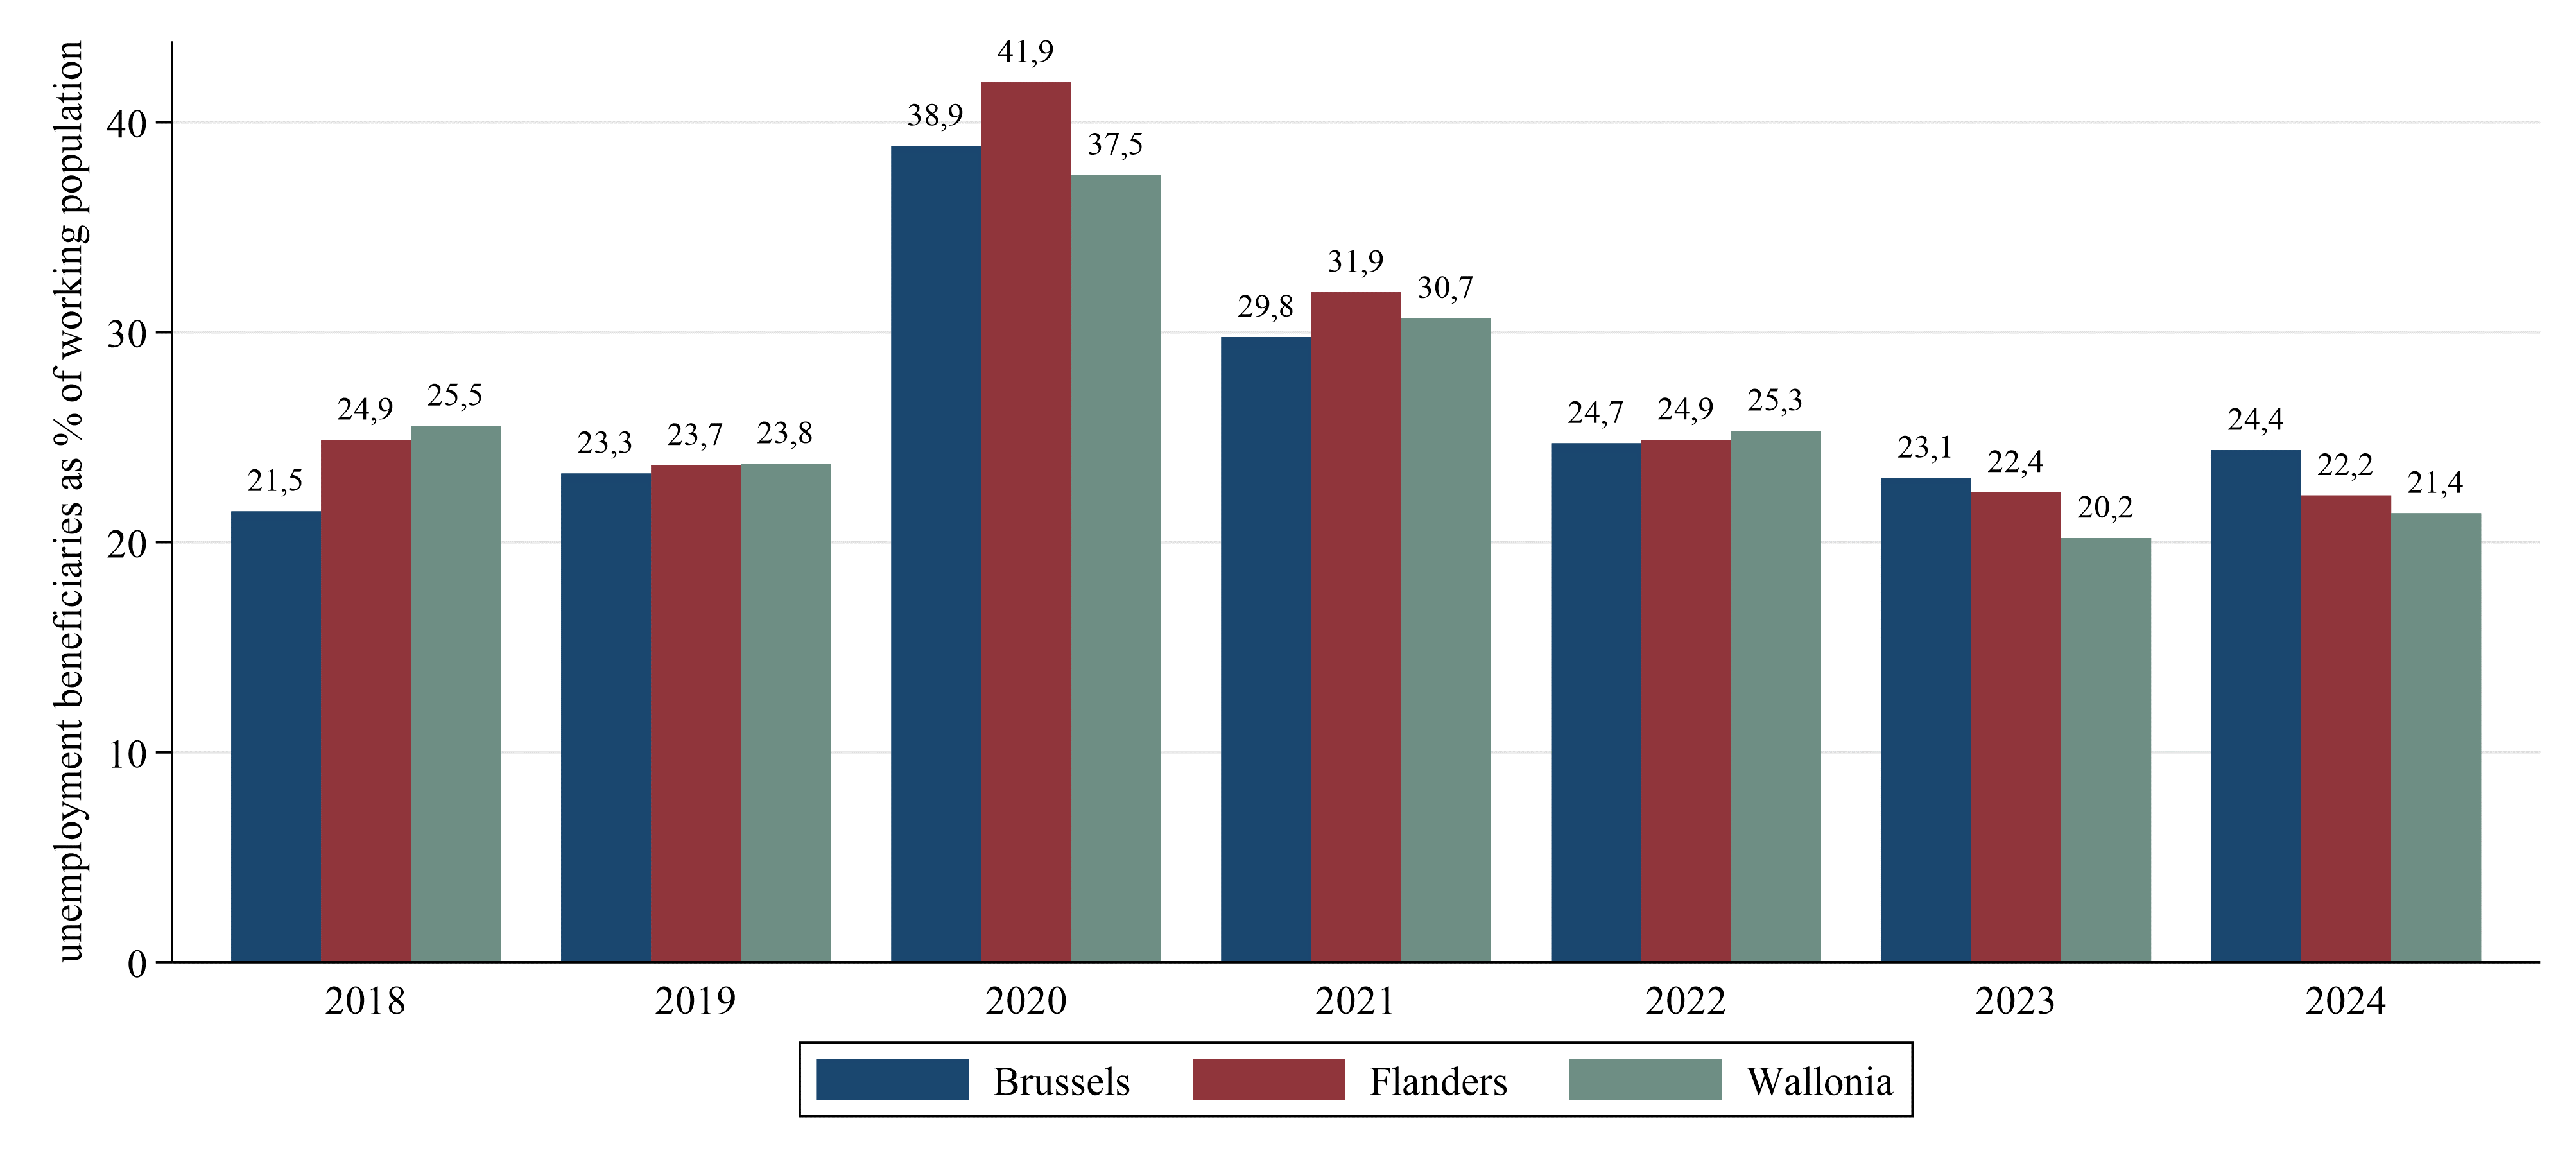
Note: It represents the number of beneficiaries of the different unemployment measures as percentage of the working population (defined as people aged 18 to 64 and not enrolled in education for those aged 18 to 24).
Source: own calculation using Luxembourg Income Study (LIS) data.
The number of beneficiaries relative to the working population shows a convergence across regions just before the Covid period, at around 23% of the workforce, compared to the previous year in which Wallonia, followed closely by Flanders, had relatively more beneficiaries than the Capital region. However, this does not reflect the actual unemployment rates, which were relatively low (under 7% throughout the whole period) (source: Statbel), since the unemployment measures also included other benefits such as early retirement.
The introduction of special Covid measures such as the Covid allowance (prime Covid / Covid premie), including a regional one (prime Covid-régionale / Covid premie-regionaal) in 2020, resulted in a substantial increase in the number of beneficiaries relative to the working population, especially in Flanders, where it reached almost 42% of the labour force, with Brussels following 3 percentage points difference and Wallonia just 1.5 percentage points behind the Capital region. The benefit was given to people who could not temporarily perform their job or run their business due to Covid (including those who had to care for their children when schools and care facilities were closed), and therefore contributed to job preservation. At the height of the Covid crisis, in April 2020, about 40% of employees in the private sector received temporary unemployment benefits and about half of the self-employed received bridging right benefits (Coppens B. et al., 2021). After the temporary measures were discontinued, we observe that the number of beneficiaries reverted to levels similar to those of the pre-Covid period, followed by a slightly descending trend in the following year. In 2024, Flanders continued on a (slightly) descending trend, while the number of beneficiaries in the Capital region and Wallonia increased slightly. This is explained by the fact that during this period unemployment rates increased in the Capital region from 10.2% in the last quarter of 2022 to 12.3% in the second quarter of 2024, while in Flanders there was only a slight increase in the last quarter of 2024 of less than 1 percentage point, reaching 4.3% — the lowest unemployment rate of all regions. Wallonia, despite a non-linear evolution during the year, had the same unemployment rate at the end of 2024 as in the previous year: 8% for those aged 15–64 (source: Statbel, 2026).
As seen in Figs. 1 and 2, Flanders has the lowest level of benefits in all years while having the highest disposable household income. This is possible because the region has the highest extended market income in all years, as shown in Fig. 4 below. Market income does not appear to have been considerably impacted by the Covid crisis: between 2019 and 2020 there was only a very small decline — more of a stagnation — while in 2021 we observe an increase in market income in all three regions, more pronounced in Flanders. The 2021 levels of market income are above pre-crisis levels, except for Wallonia, for which they remain slightly below. Over the years, the gap between Flanders and Wallonia has been widening, from 10 percent in 2004 to almost 20 percent in 2024.At the same time, the Brussels region has been narrowing the gap with Wallonia in market income over the past two decades, as shown in Fig. 4 below This pattern is consistent with the findings of the OECD (2022).
Fig. 4: Evolution of extended market income by region over time: 2004–2024
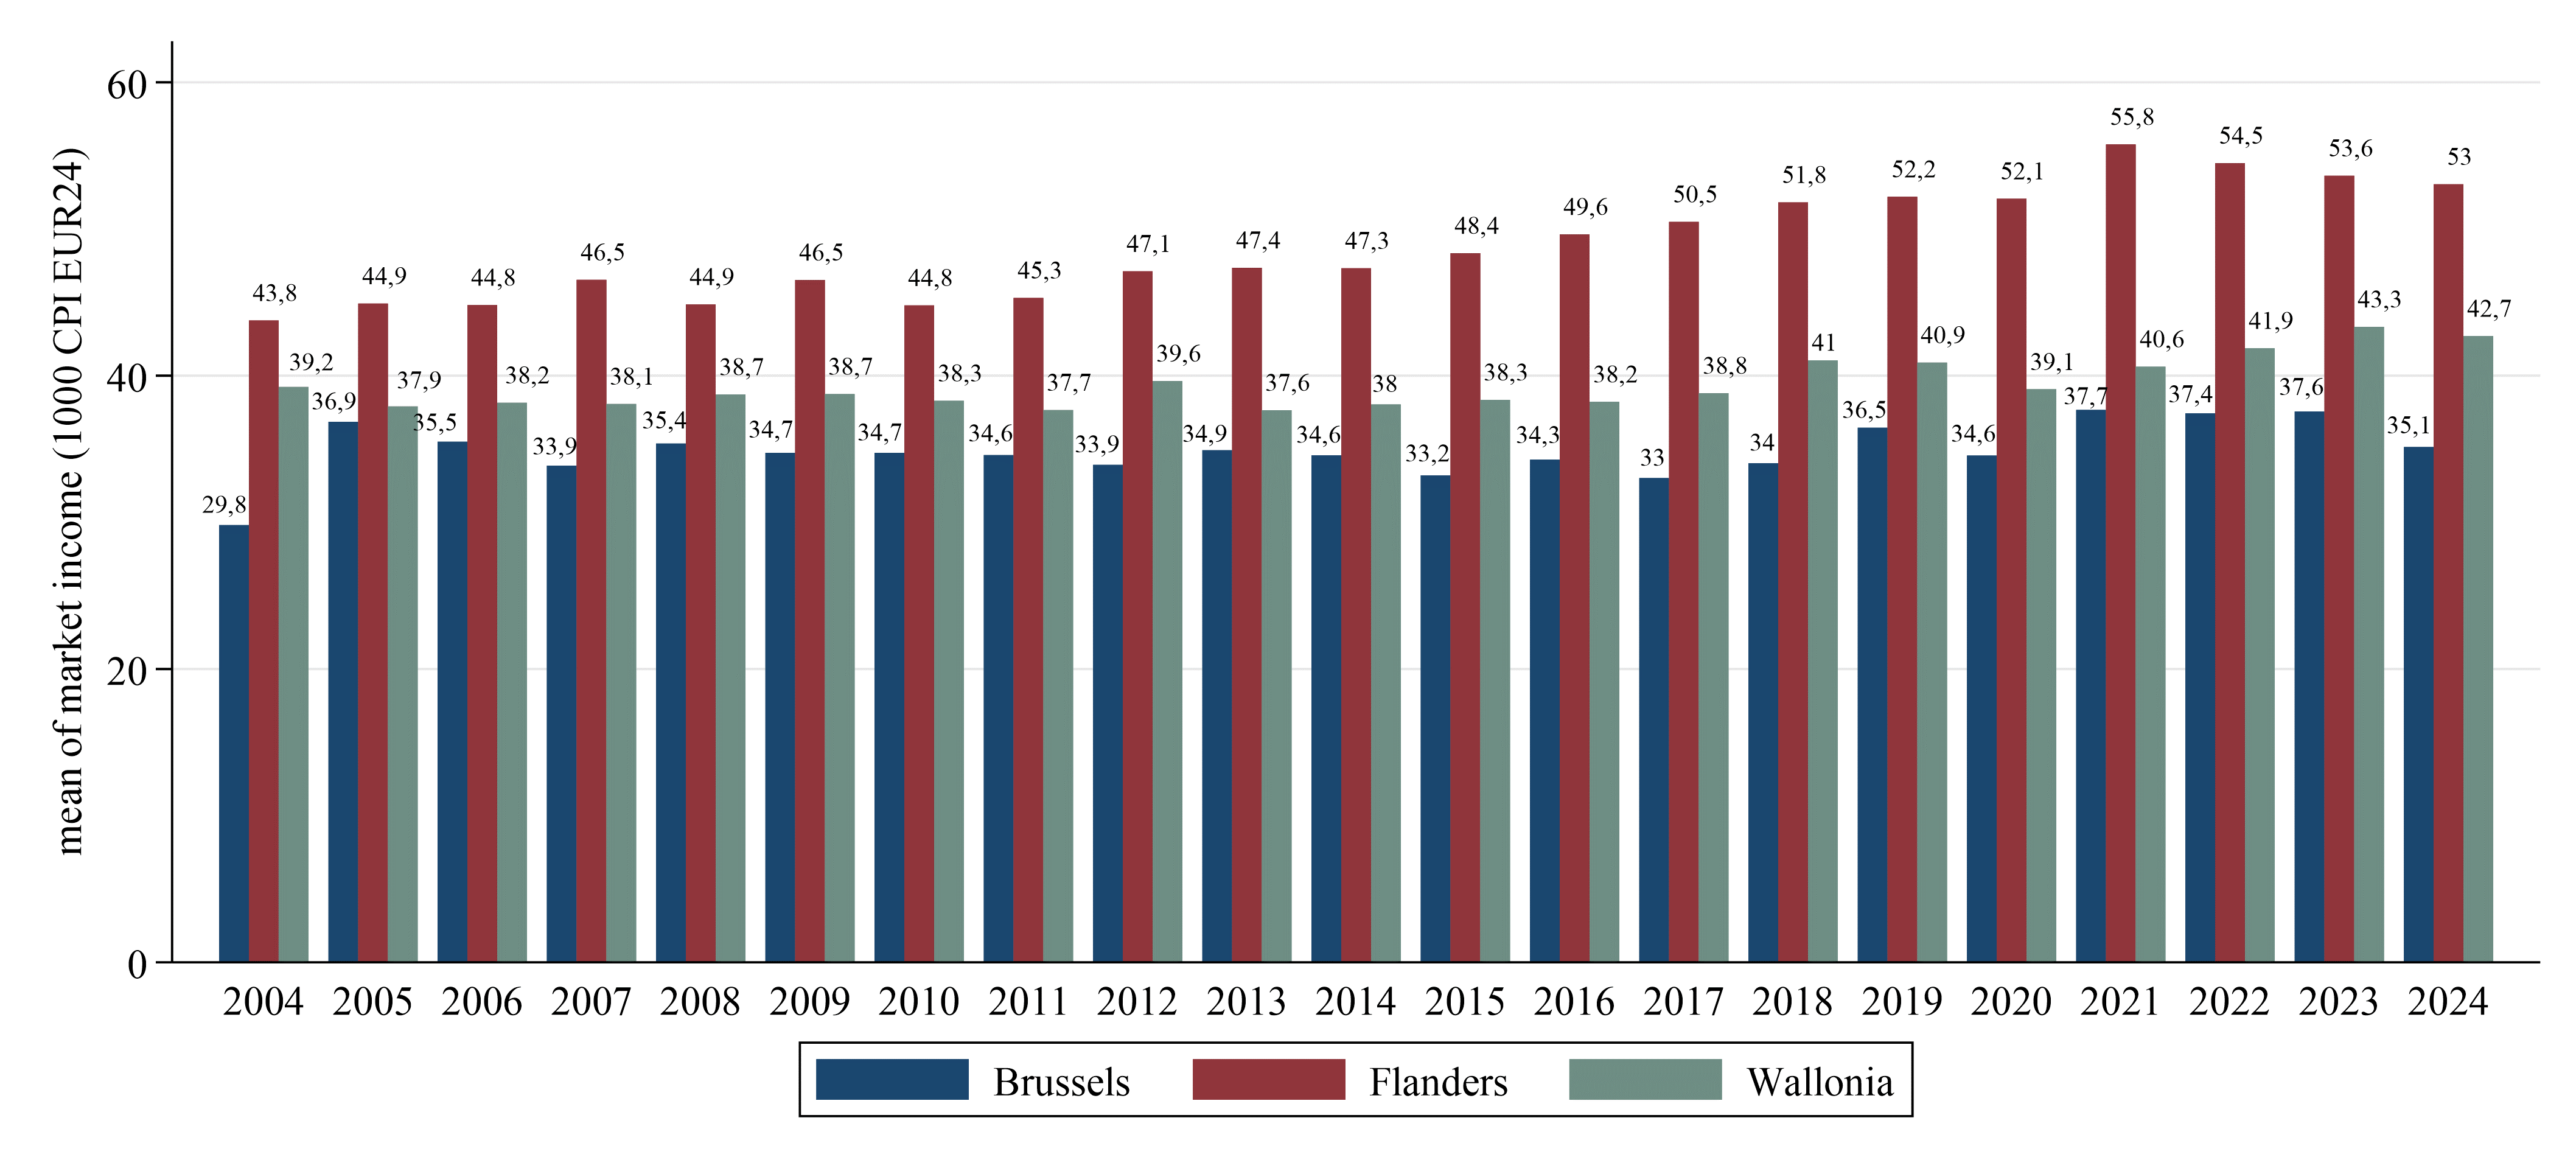
Note: Extended market income is calculated as the sum of labour income, capital income (including private pensions), all contributory pensions, and private transfers. The value was equivalised by the square root of household members and bottom-coded (with negative values set to 0) and top-coded (at 10× the median). It is expressed in 1,000 EUR adjusted with the CPI at the 2024 price index.
Source: own calculation using Luxembourg Income Study (LIS) data.
To conclude, the disposable income of Belgian households was not significantly impacted by the Covid crisis as a result of the measures put into place — especially temporary unemployment schemes allowed employees to keep their jobs and the self-employed to maintain their businesses. Disparities between regions are still observed, with households in Flanders having by far the highest disposable income, largely due to extended market income rather than social benefits, while the gap between the Brussels region and Wallonia tends to narrow. These conclusions are supported by other studies, which highlight that despite the initial economic shock caused by the Covid crisis and lockdowns, the long-term impact on the labour market was very limited, thanks to the successful social policy measures implemented by the Government (Coppens et al., 2021).
References
| Belgian Debt Agency and National Bank of Belgium (2022a). Belgian prime news, Issue 94, January 2022. Brussels: National Bank of Belgium. Available at: “https://www.debtagency.be/sites/default/files/content/download/files/bpn94.pdf |
| Belgian Debt Agency and National Bank of Belgium (2022b). Belgian prime news, Issue 97, September 2022. Brussels: National Bank of Belgium. Available at: https://www.debtagency.be/sites/default/files/content/download/files/bpn97.pdf |
| Coppens, B. , Minne, G., Piton, C. , Warisse , Ch. (2021). The Belgian economy in the wake of the COVID-19 shock, NBB Economic Review, September 2021. https://www.simmons-simmons.com/en/publications/ckcbrtet0brs00979hsihs0j8/coronavirus-covid-19—a-new-set-of-measures-for-belgium |
| Duprez, C., Nautet, M. (2019). Economic flows between Regions in Belgium, NBB Economic Review, December 2019. |
| FPS Finance and FPS Public Health, Food Chain Safety and Environment (2025). Federal Inventory of Fossil Fuel Subsidies, General Tax Policy Directorate – Studies Department & DG Environment – Climate Change Department, Brussels, D/2025/2196/19, available at https://financien.belgium.be/sites/default/files/2405672_Climate_change_inventaris_EN_samenvatting_v3.pdf. |
| IEA (2022). Belgium 2022 Energy Policy Review. IEA Energy Policy Reviews. OECD Publishing, Paris. https://doi.org/10.1787/48c1928f-en |
| OECD (2022). Regions and cities at a glance 2020- country note Belgium, OECD, available at https://www.oecd.org/content/dam/oecd/en/publications/reports/2025/01/oecd-regions-and-cities-at-a-glance-2020-country-notes_d8fe2677/belgium_8e12b6b9/6f255a4a-en.pdf |
| Service public fédéral Sécurité sociale (2022). Tout ce que vous avez toujours voulu savoir sur la sécurité sociale, D 2022/10.770/13 , 2022 at https://socialsecurity.belgium.be/sites/default/files/content/docs/fr/publications/tout-ce-que-securite-sociale-fr.pdf |
| Statbel (2026). Employment and unemployment. Belgian Federal Government, https://statbel.fgov.be/en/themes/work-training/labour-market/employment-and-unemployment Belgian Statistical Office (STATBEL) at: https://statbel.fgov.be/ |
| Strale, M. (2019). Les déplacements entre Bruxelles et sa périphérie : des situations contrastées, Brussels Studies [En ligne], Collection générale, document 137, mis en ligne le 08 juillet 2019. DOI : https://doi.org/10.4000/brussels.2831 |