Data Access Research Tool (DART)
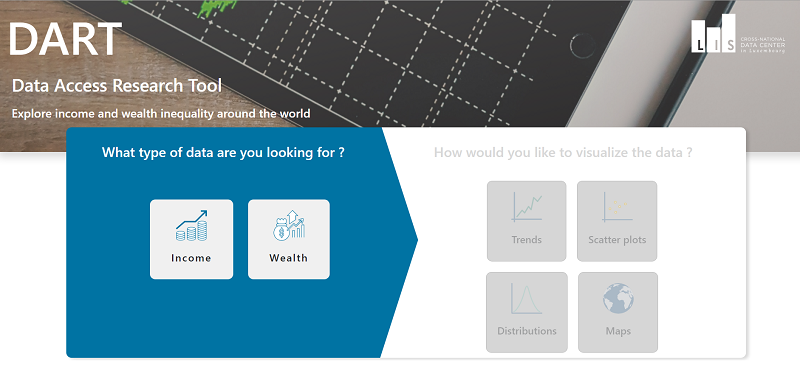
DART is a powerful web-based interactive tool that allows users to select and visualise income and wealth indicators, countries, and time periods, and to decompose them by a multitude of individual and household characteristics, all based on the LIS harmonised databases.
With the launch of DART, LIS breaks new ground with data provision, as a broader base of users, including scholars, journalists, teachers, NGO staff, other analysts, and the general public, will be able to easily obtain and visualize a rich array of income and wealth indicators disaggregated across several dimensions.
DART Main Features
- Richness of overtime and cross-county inequality measures disaggregated by different social strata.
- No prior knowledge of statistical packages or coding skills required.
- Visualisation of data through different charting types (Trends, Scatter plots, Distributions, and Maps).
- Table format display of the aggregated data used to generate the plotted graph(s).
- Export of all the graphs/tables produced in pdf and excel formats.
| Access DART |
Datasets Coverage
DART harnesses microdata from both the Luxembourg Income Study (LIS) and the Luxembourg Wealth Study (LWS) databases.
Types of Charts in DART
DART provides four different kinds of charts (Trends, Scatter plots, Distributions, and Maps), to serve the most common visualisation needs of the users:
- Trends: Trends are line charts that display the information of a selected indicator (for example the Gini coefficient) of a selected aggregate (for example disposable household income) over a selected range of years for one or more countries. The information can as well be disaggregated by different household/individual characteristics.
- Scatter plots: Scatter plots display the relationship (values) between two income/wealth indicators for a selected year (for example plotting the Gini coefficient of gross wages vs. the Gini Coefficient of disposable household income for 2013).
- Distributions: DART provides two charts to display distributions; namely Lorenz Curve and Density Function:
- Maps: Maps display geographic data of a specific indicator on different income/wealth aggregates for a selected year (for example map chart of the Gini index of disposable household income in 2008).
– Lorenz Curve: The Lorenz Curve is the representation of the distribution of a specific income/wealth aggregate, that can be disaggregated by different characteristics in a specific year (for example Lorenz Curve of disposable net worth decomposed by home ownership in 2013 for a number of countries).
– Density Function: The Density Function is a graph determining the shape of distributions; the area under the density curve between two points corresponds to the probability that the variable falls between those two values. For estimation of probability density functions, kernel density estimation is applied.
Aggregate, Indicators, and Decompositions
The main feature of DART is the ability to plot different indicators for a number of income/wealth main aggregates, that can be disaggregated by selected individual/household characteristics over time and for different countries.
View aggregates, indicators, and decompositions available in DART »
Methodological Notes
For more information on the definitions and construction of DART aggregates, indicators, and decompositions,
View Methodological Notes here »
Download Methodological Notes in pdf format here »
Visualisation of LIS Key Figures in DART
One of the main features of DART is allowing LIS users to obtain and visualise many of the LIS Key Figures. Moreover, these key figures can now be disaggregated by various dimensions.
For instance, to obtain the relative poverty rates for the children and the elderly, users should decompose the relative poverty rate of the equivalised disposable household income by age groups.
LIS Key Figures can still be accessed here »
LIS rules for citation
Users of DART are required to cite the data source in their list of references. As suggested by the Chicago Manual of Style (15th edition, 2007) pp 753-754 (17.358), LIS requests that authors use the following format.