Issue, No.38 (June 2026)
The Anatomy of Consumption Inequality: What Drives Differences Across Countries?
Key messages
- Consumption inequality is not driven by the same expenditure categories everywhere: food matters most in poorer and more vulnerable economies, while housing plays a larger role in many richer economies.
- Looking beyond broad development patterns reveals important country-specific differences, such as the large role of transport in Georgia and recreation and restaurants in the United Kingdom.
- The upcoming Luxembourg Consumption Study will make it possible to examine these patterns in greater depth, including differences within countries and across the consumption distribution.
Household budgets tell a story about inequality that income alone cannot fully reveal. Many countries conduct high-quality consumption surveys, but unlike income data, harmonized consumption data remain relatively scarce. The upcoming Luxembourg Consumption Study (LCS) will open new opportunities to examine not only how unequal consumption is across countries, but also which parts of the household budget drive that inequality.
What do consumption data tell us that income data do not? While income tells us what households receive, consumption shows how those resources are translated into food, housing, transport, leisure, and other elements of daily life. Detailed expenditure data also reveal differences in living standards, from diet quality to access to durable goods and services. Because households can smooth consumption through savings, borrowing, and informal support, consumption is often more stable than current income and more informative for studying long-run welfare (Friedman, 1957; Deaton & Zaidi, 2002).
This article examines consumption inequality and its drivers across nine countries with different levels of development, from low-income, represented by Mali, to high-income economies such as France, Italy, the United Kingdom, and the United States. The lower-middle-income group is particularly heterogeneous: Laos had only recently transitioned out of the low-income category at the time of the survey, while Palestine was approaching upper-middle-income status. The upper-middle-income group is equally varied, combining Peru, a rapidly developing Latin American economy, with Georgia, a post-transition economy characterized by strong links between Europe and Asia. Together, these countries allow us to compare consumption inequality across very different economic and institutional contexts.
Rather than focusing solely on inequality levels, we ask which expenditure categories account for the largest shares of consumption inequality and whether those patterns differ systematically across national contexts. To address this question, we apply the Lerman-Yitzhaki decomposition (Lerman & Yitzhaki, 1984, 1985), where the Gini coefficient of consumption inequality is expressed as the sum of contributions from individual expenditure components:
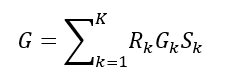
where (Sk) is the share of expenditure category (k) in total consumption, (Gk) is the Gini coefficient of that category, and (Rk) is the Gini correlation between expenditure in that category and total consumption.
The appeal of this approach is that it not only identifies the expenditure categories that contribute most to overall inequality, but also explains why they matter. A category may emerge as an important source of inequality because it accounts for a large share of household budgets, because spending on it is itself highly unequal, or because it is disproportionately concentrated among households at the upper end in the overall consumption distribution. This method has been widely used to analyse the sources of income inequality within and across countries, and has been more recently applied to consumption data in a number of country studies (Garner 1993, Garner et al. 2024; Oliveira et al. 2016; Mookodi 2021). While these studies have generated important insights into the structure of consumption inequality within individual countries, much less is known about how the drivers of consumption inequality differ across countries at different stages of development. The harmonized consumption data assembled in preparation for the LIS Consumption Study (LCS)i provided a rare opportunity to examine these differences in a comparative setting.
The anatomy of consumption inequality
In most countries, housing or food are the largest contributors to consumption inequality (Table 1). Georgia is an exception. There, transport contributes to nearly one-third of measured consumption inequality, more than either housing or food. This finding illustrates a broader lesson from comparing nine countries spanning low-, middle-, and high-income settings: consumption inequality is not generated by the same expenditure categories everywhere.
Table 1. A ranked comparison of top three contributors to consumption inequality by country, from largest to smallest
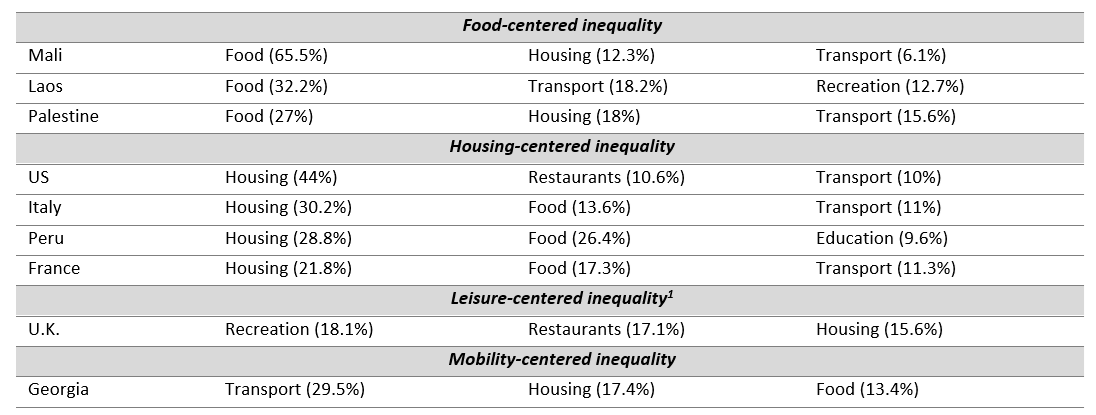
Note: Table 1 shows the three expenditure categories that contribute most to consumption inequality in each country. The percentages indicate each category’s share of total consumption inequality (not its share of household expenditure). Countries are grouped according to the expenditure category that plays the largest role in explaining overall consumption inequality.
Source: Author’s calculations based on harmonized consumption datasets prepared by the LIS team for France 2010, Georgia 2021, Italy 2016, Laos 2012, Mali 2020, Palestine 2017, Peru 2019, and the United Kingdom 2021. The U.S. results are based on the 2022 Consumer Expenditure Survey, harmonized by the U.S. Bureau of Labor Statistics.
The fact that food is the dominant contributor to consumption inequality in low and low-middle income countries Mali, Laos and Palestine can be partly understood through Engel’s law, which states that the share of household expenditure devoted to food declines as income rises. In low-income and agriculture-dependent economies such as Mali, many households spend a large share of their budgets on basic food needs, making overall living standards highly sensitive to fluctuations in food prices, harvest conditions, and household purchasing power. Differences in households’ ability to cope with droughts, inflation, or income instability can therefore translate directly into large disparities in food consumption.
Just as with food, housing contributes substantially to consumption inequality due to its budget importance, and not because it is the most unequal among expenditure categories. As Figure 1 shows, the contribution of housing to consumption inequality is broadly proportional to its share in total consumption in most countries. We observe housing-centered consumption inequality1 in higher-income countries such as Italy, France and the US as well as Peru. This likely reflects the growing importance of housing costs as countries urbanize and living standards rise, with disparities in housing quality, ownership, and location becoming increasingly important dimensions of household welfare (OECD, 2021).
Figure 1. Expenditure shares and contributions to consumption inequality, by category and country
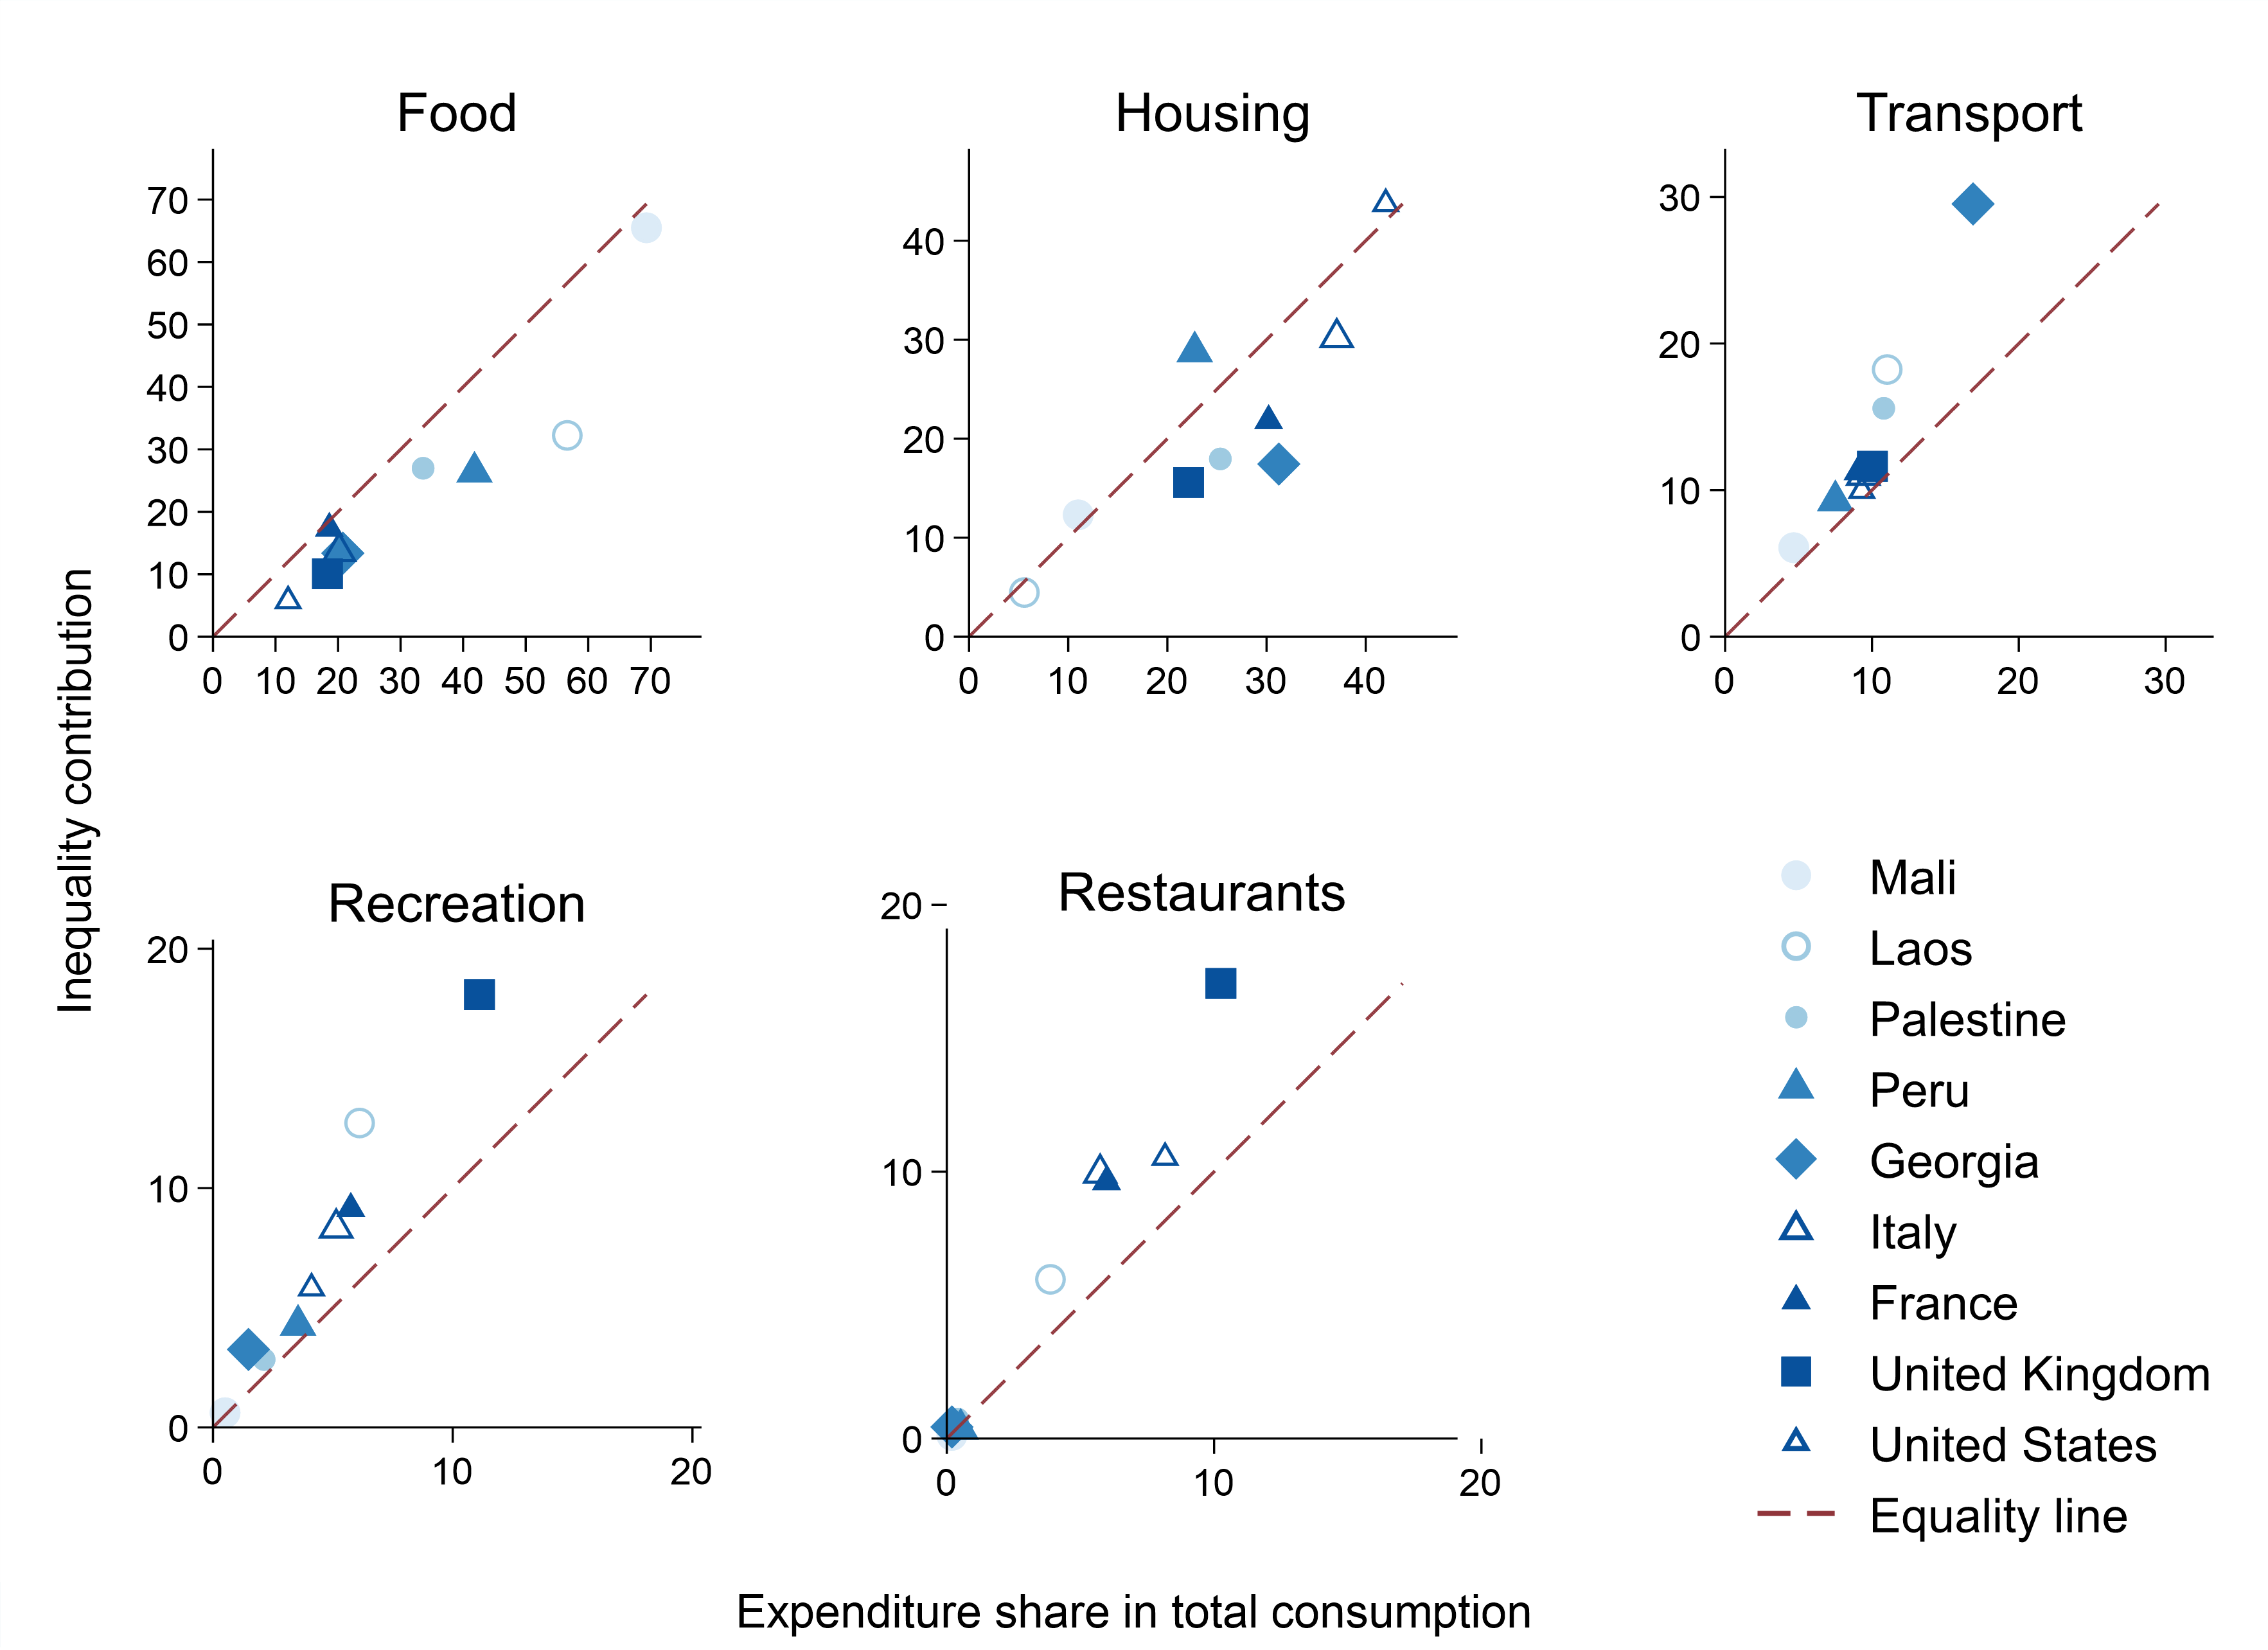
Note: Each panel plots an expenditure category’s share in total consumption against its contribution to overall consumption inequality. The dashed line marks equality between the two. Points above the line indicate categories that contribute more to inequality than their budget share would suggest; points below the line indicate categories that contribute less.
Source: Author’s calculations based on harmonized consumption datasets prepared by the LIS team for France 2010, Georgia 2021, Italy 2016, Laos 2012, Mali 2020, Palestine 2017, Peru 2019, and the United Kingdom 2021. The U.S. results are based on the 2022 Consumer Expenditure Survey, harmonized by the U.S. Bureau of Labor Statistics.
Georgia complicates the development story. Transport, rather than food or housing, is the largest contributor to consumption inequality. Unlike housing, transport lies well above the equality line in Figure 1: it accounts for 16.9% of overall household expenditure, yet it contributes to 29.5% of total consumption inequality. This pattern may reflect unequal access to private mobility and transport-intensive consumption within Georgia’s transition economy. Existing evidence further suggests that transport-related subsidies in Georgia disproportionately benefit higher-income urban households, pointing to persistent inequalities in access to mobility and transport infrastructure (World Bank, 2025). However, Georgia’s transport result should still be interpreted cautiously. Its large contribution to consumption inequality reflects both the strong concentration of transport spending among better-off households and transport’s relatively large share in total expenditure (Figure 1). Moreover, the transport category may capture different forms of mobility expenditure across countries, as well as urban–rural differences in access, infrastructure, and commuting patterns.
Recreation and restaurants are other examples of categories that contribute more to inequality than their budget shares alone would suggest. In the United Kingdom, both categories lie above the equality line in Figure 1: together they account for 21.4% of overall consumption expenditure, yet contribute to 35.1% of total consumption inequality. These categories contribute disproportionately to inequality because spending on leisure, dining, and recreational activities is highly differentiated across households and strongly associated with disposable income and lifestyle. The United Kingdom stands out as a highly service-oriented economy, where welfare differences are increasingly reflected not only in access to basic goods, but also in the ability to participate in consumption-intensive social and cultural activities (OECD, 2019).
Taken together, these results show that consumption inequality is not driven by the same expenditure categories everywhere. While food contributes more to consumption inequality in poorer and more vulnerable countries, housing often becomes more prominent in richer economies, reflecting the growing importance of housing costs, quality, ownership, and location. However, the examples of Georgia and the United Kingdom show why it is useful to look beyond this broad development pattern. The upcoming Luxembourg Consumption Study will provide more opportunities to examine these patterns in greater depth, including differences between urban and rural households, household types, and different parts of the consumption distribution.
1 The contribution of housing to consumption inequality is likely underestimated in the United Kingdom and Laos due to the absence of imputed rent data.
i The results presented here build on the broader LIS harmonization effort described in Building a Comparable Measure of Consumption: Concepts and Measurement Challenges Faced by Emerging and Advanced Economies (Garner et al., 2025). As part of this work, the LIS team harmonized household survey datasets from France (fr10), Georgia (ge21), Italy (it16), Laos (la12), Mali (ml20), Palestine (ps17), Peru (pe19), and the United Kingdom (uk21), while the Bureau of Labor Statistics (BLS) team harmonized the U.S. Consumer Expenditure Survey (CE) dataset (us22). This effort enables cross-country comparisons of the underlying drivers of inequality.
References
| Deaton, A., and Zaidi, S. (2002), “Guidelines for Constructing Consumption Aggregates for Welfare Analysis”, LSMS Working Paper No. 135, World Bank, Washington, DC. |
| Friedman, M. (1957), “The Permanent Income Hypothesis”, in A Theory of the Consumption Function, Princeton University Press, Princeton, NJ, pp. 20–37. |
| Garner, T. I. (1993), “Consumer Expenditures and Inequality: An Analysis Based on Decomposition of the Gini Coefficient”, The Review of Economics and Statistics, 75(1), pp. 134–138. |
| Garner, T. I., Matsumoto, B., and Schild, J. (2024), “Consumption Inequality During and After the COVID-19 Pandemic”, BLS Working Paper No. 573, U.S. Bureau of Labor Statistics, Washington, DC. |
| Garner, T., Lanjouw, P. F., Matsumoto, B., Mazeikaite, G., Munzi, T., Neugschwender, J., Omar, H., and Schild, J. (2025), “Building a Comparable Measure of Consumption: Concepts and Measurement Challenges Faced by Emerging and Advanced Economies”, LIS Working Paper Series No. 912, LIS Cross-National Data Center in Luxembourg. |
| Lerman, R. I., and Yitzhaki, S. (1984), “A Note on the Calculation and Interpretation of the Gini Index”, Economics Letters, 15(3–4), pp. 363–368. |
| Lerman, R. I., and Yitzhaki, S. (1985), “Income Inequality Effects by Income Source: A New Approach and Applications to the United States”, The Review of Economics and Statistics, 67(1), pp. 151–156. |
| Mookodi, L. (2021), “Decomposition Analysis of the Gini Coefficient of Consumer Expenditures in Botswana”, Development Southern Africa, 38(4), pp. 622–642. |
| OECD (2019), Under Pressure: The Squeezed Middle Class, OECD Publishing, Paris. |
| OECD (2021), Brick by Brick: Building Better Housing Policies, OECD Publishing, Paris. https://doi.org/10.1787/b453b043-en |
| Oliveira, L. S., de Souza, D. F., dos Santos, L. A., Antunes, M., Brendolin, N. C., and Quintaes, V. C. (2016), “Construction of a Consumption Aggregate Based on Information from POF 2008–2009 and Its Use in the Measurement of Welfare, Poverty, Inequality and Vulnerability of Families”, Review of Income and Wealth, 62, pp. S179–S210. |
| World Bank (2025), Navigating Fiscal Realities for Equitable Growth in Georgia, World Bank Group, Washington, DC. |