“Luxembourg poverty statistics in motion”
![]()
Watch the video here.
Stay tuned for the forthcoming LISER policy brief, which will present the analysis and cross-country comparison in detail.
“You study poverty in Luxembourg? So you think anyone is in poverty in the richest EU country?’ “Yes. Because poverty is relative.” Over the last forty years, Luxembourg has experienced sustained economic and population growth. According to estimation based on the Luxembourg Income Study, average real disposable income expressed in 2022 prices rose from €25,000 in 1985 to €51,500 in 2023 – an average annual growth rate of 1.97%. Yet, the latest national statistics on poverty show that 18.1% of the population is ‘at risk of poverty’ (STATEC, 2025). And the rate is on an upward trend – up from, e.g., 14.5% in 2010 and 16.4% in 2017. While Luxembourg has largely achieved in its resident population the UN’s Sustainable Development Goals (SDG) 1.1 of “eradicating extreme poverty by 2030 for all people everywhere” currently measured as people living on less than $2.15 a day, achieving SDG 1.2 “to reduce by 2030 at least by half the proportion of men, women and children of all ages living in poverty in all its dimensions according to national definitions” appears utopian.
Key to SDG 1.2 is the according to national definitions clause. The “at-risk-of-poverty” indicator – or poverty rate, for short – is defined as the percentage of the population living in households whose annual disposable income is below 60% of the national median. Reducing relative poverty therefore not just requires a growth in low incomes, it requires that incomes at the bottom grow faster than incomes around the middle of the distribution. This is what is needed for the country to meet its SDG 1.2 target.
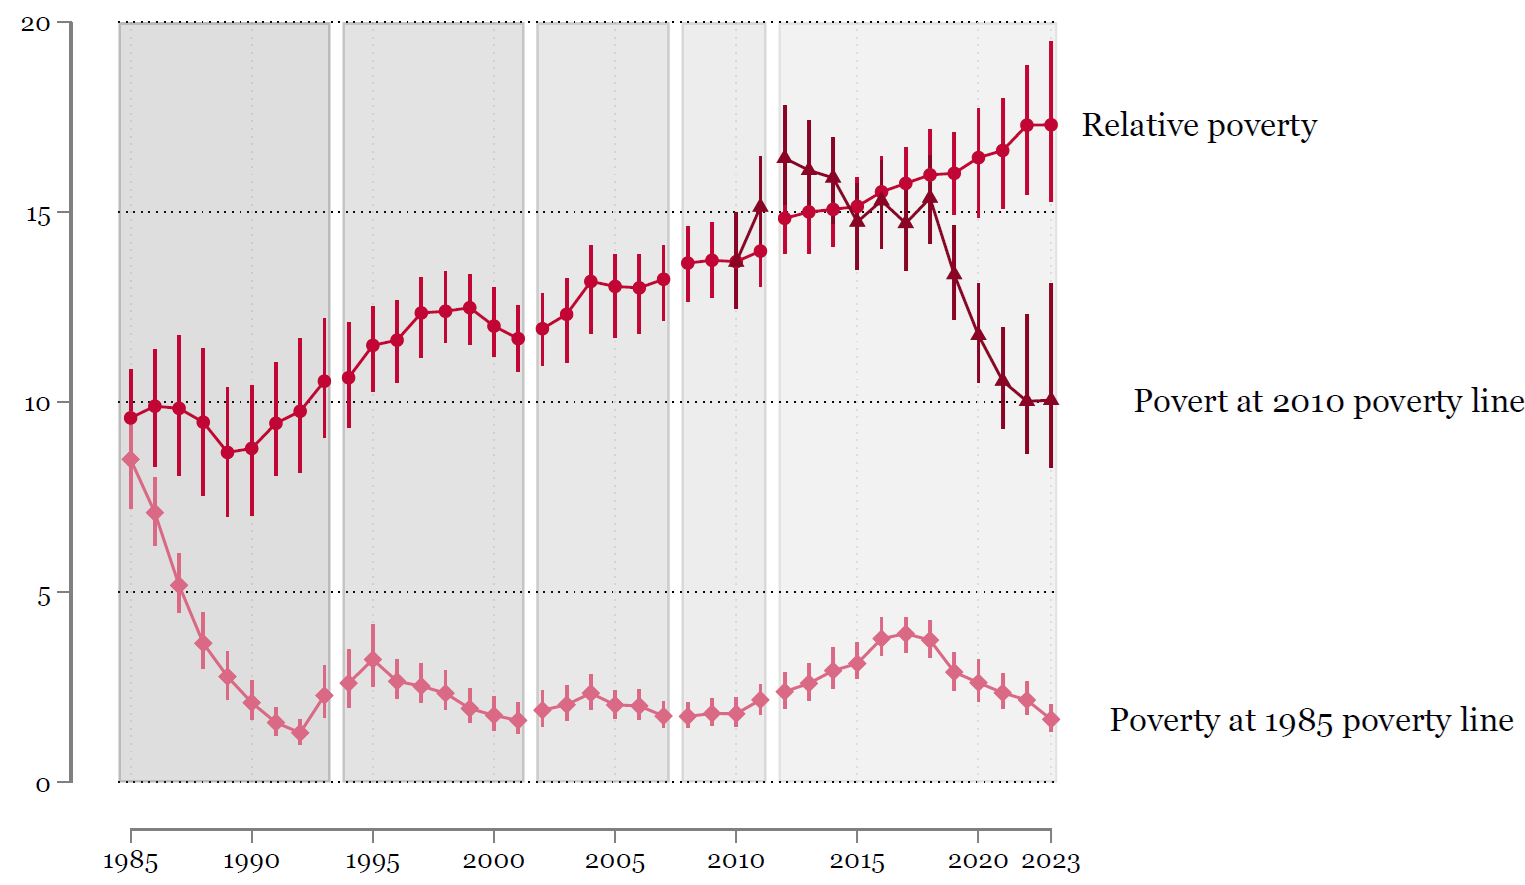
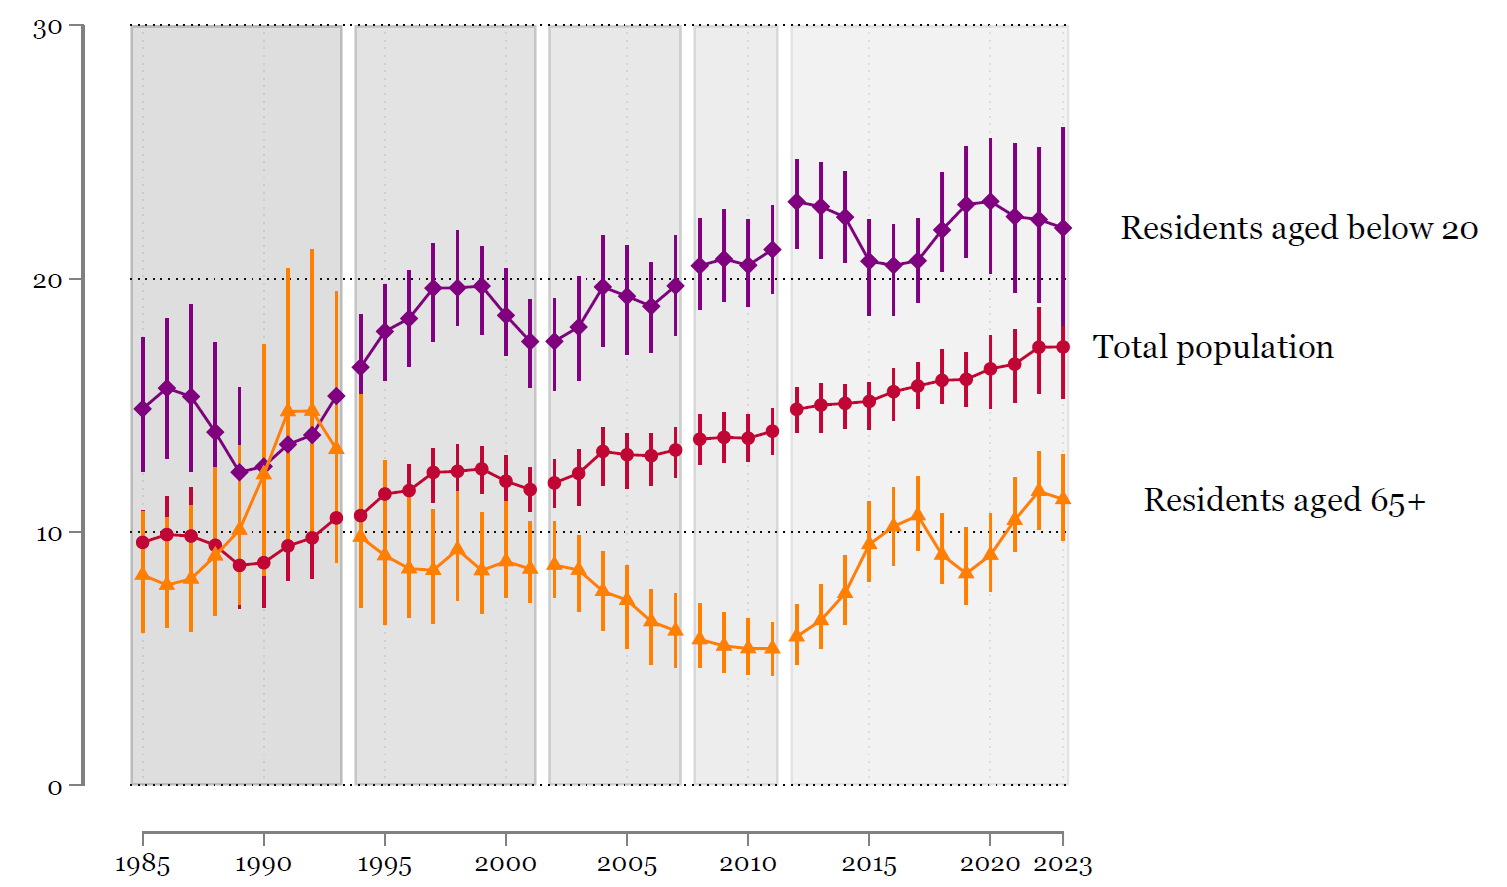
Figure 1 presents estimates of the evolution of the poverty rate in Luxembourg from 1985 to 2023 based on the series compiled in LIS. The figure shows the aggregate poverty rate and poverty rates among individuals under age 20, and among individuals aged at least 65. (Here and in all subsequent figures, we show 3-year moving averages of each estimate to smooth out transitory variations and focus on long-term trends.) These estimates confirm the upward trend documented in official statistics. Our estimates indicate an increase from 9.5% in 1985 to 17.3% in 2023 – almost a doubling of the share of the population in
(relative) poverty.
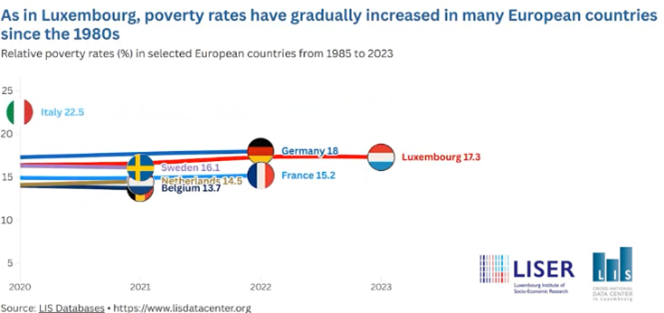
These estimates are in line with those found in other EU countries. Figure 2 compares Luxembourg’s poverty rates to those of five selected European countries – neighbouring Belgium, France and Germany as well as a Scandinavian country (Sweden) and a Mediterranean country (Italy). By 2023, Luxembourg has the third highest poverty rate in this group. What is notable is the steeper increase in poverty rates relative to neighboring and other EU countries over the 40 years period. None of the five countries compared experienced an increase of poverty as large as Luxembourg’s.
Figure 1 – Trends in poverty rates – aggregate for selected age groups (3-year moving averages)
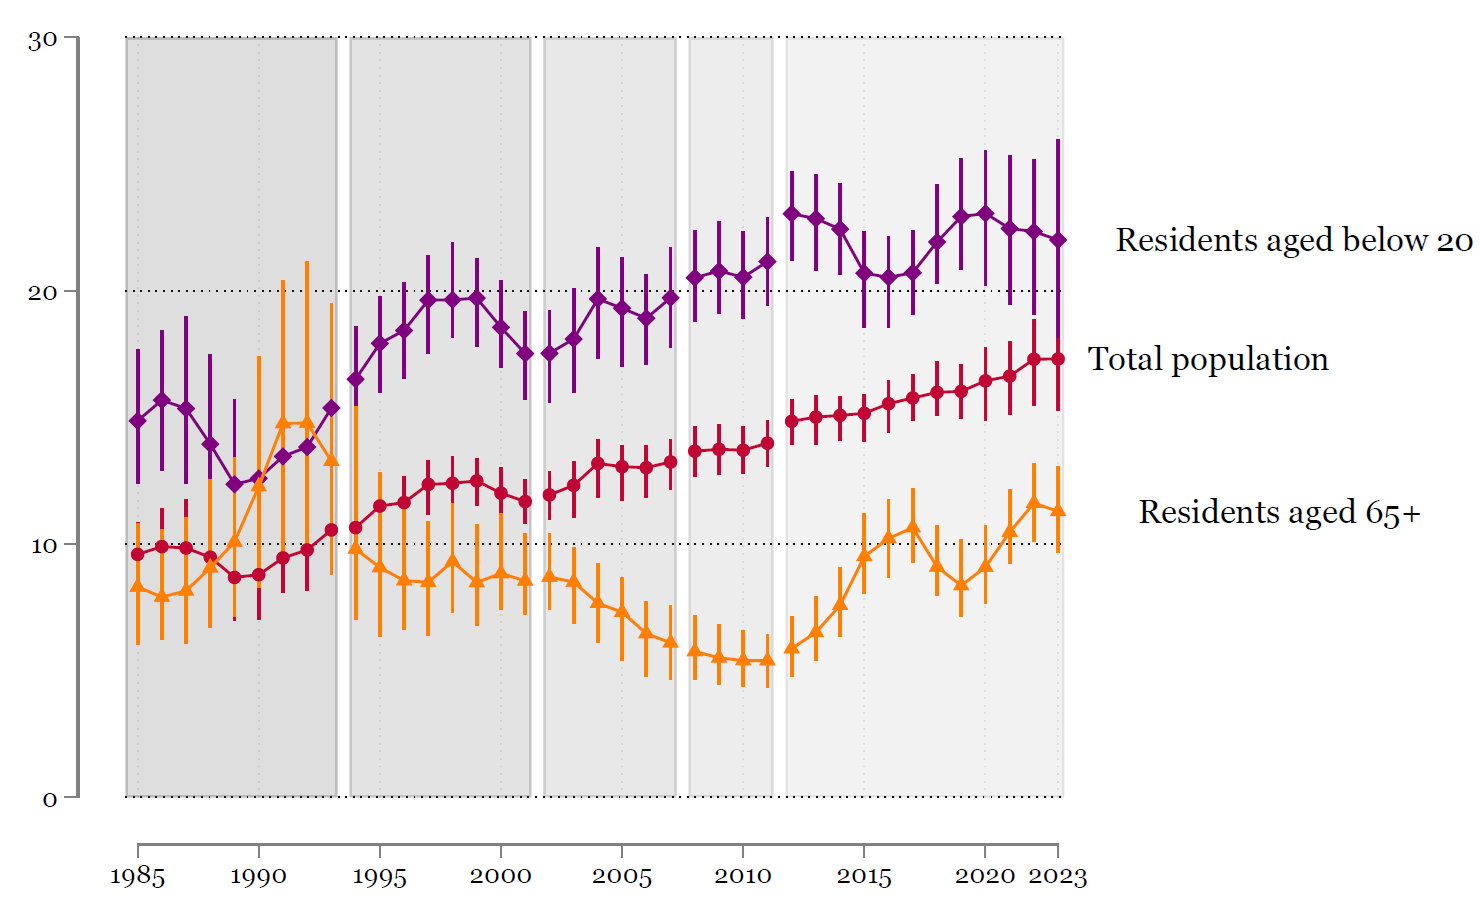
Figure 2 – Trends in poverty rates in Luxembourg and selected EU countries
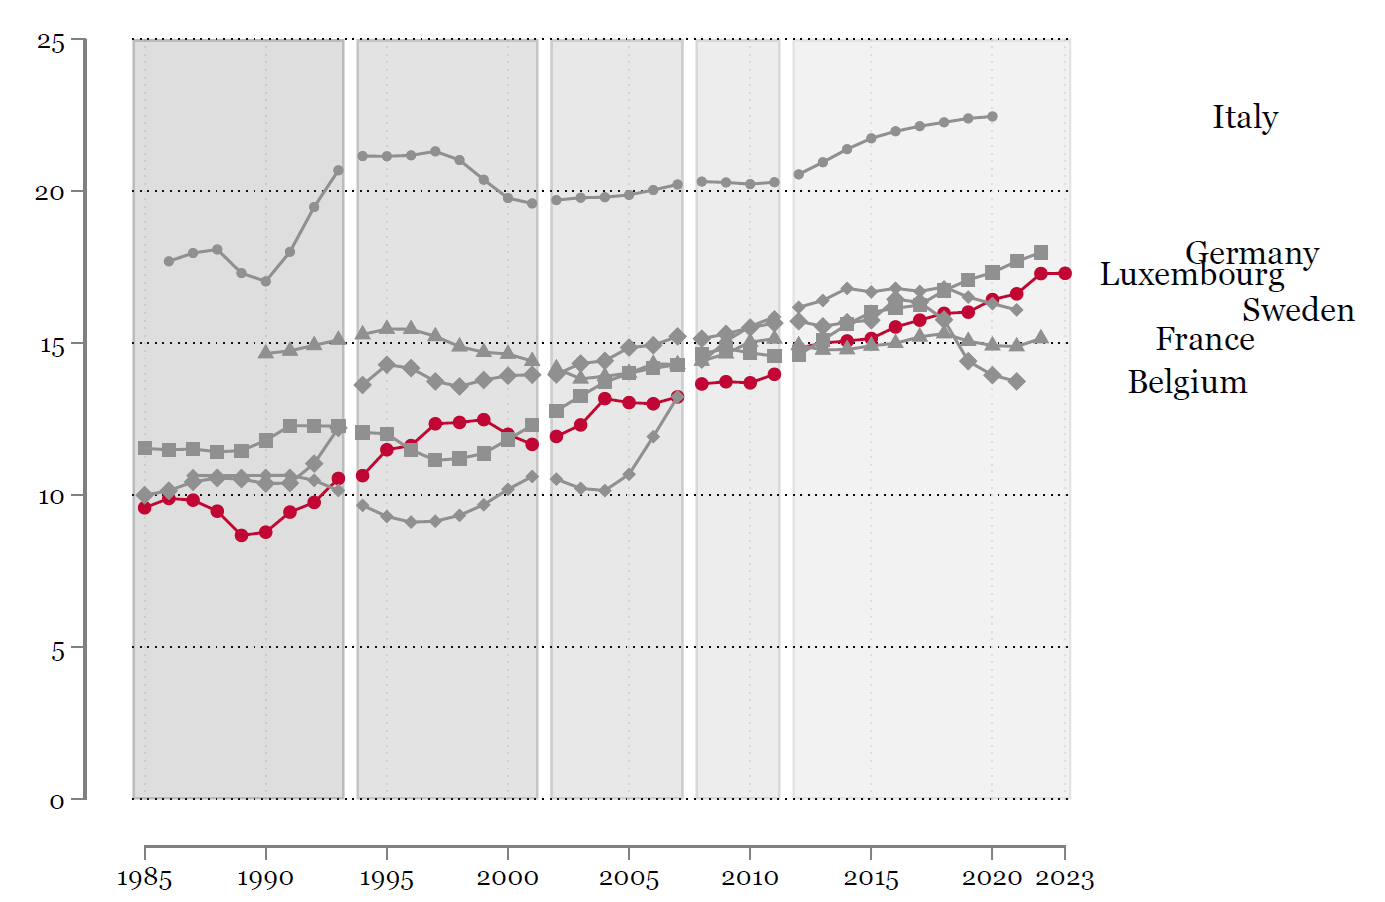
Poverty rates among children and teenagers has been systematically higher than poverty rates in the overall population. Estimates are around or above 20% since about 2008 and the onset of the Great Recession. In our comparison group of six countries, only Italy has higher poverty rates for residents aged below 20. By contrast, the situation of the elderly improved during the 1990s, and despite a recent uptick, their poverty rate in 2023 had declined to approximately 11%, half the rate observed among the younger age group. The relative improvement among the elderly is not atypical. France also experienced low levels of elderly poverty rates and many countries observed stagnating or declining elderly poverty – but Luxembourg exhibit the lowest rate of elderly poverty in most years.
While poverty rates vary by age group, age is certainly not the main nor most important driver of poverty risks. Variations in poverty risks within age groups are large – much larger than variations between age groups. Figure 3 illustrates the diversity of poverty risks across population subgroups defined by combinations of age, of household structure, and of sex, education, nationality and age of the household head. The diagram show estimates of poverty risks for 103 groups formed by combinations of these characteristics. Estimates of poverty risks were derived using a machine learning predictor (random forest). Following up on our age-based perspective, groups are bundled by age: the purple spikes show poverty risks for groups involving children and teenagers, brown spikes are for residents aged 20–34, 35–49, and 50–64 (with the age groups ordered counter-clockwise, next to the purple, the group aged 20-34, and then the two remaining groups 35–49, and 50–64), and orange spikes are risks for groups involving residents aged at least 65. We highlight key attributes of the groups that have a poverty risk higher than 250% of the national average.
Figure 3 – Diversity of poverty risks
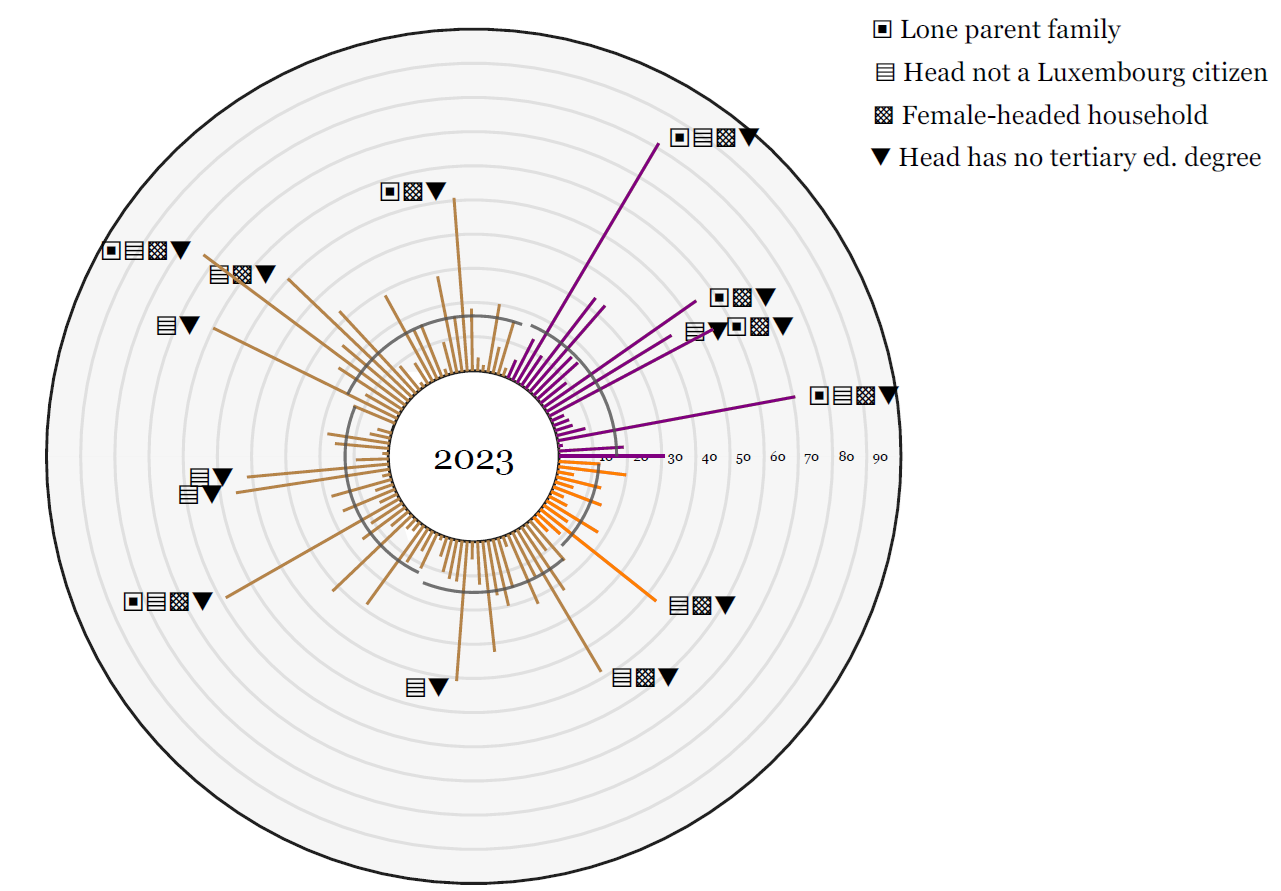
Many combinations of attributes are associated with low poverty risks while others have estimated risks close to 75%. Groups facing risks above 250% of the average are found in all age groups. There is consistency in the profile of the high risk group: all the households that are part of the high risk group are headed by a person without tertiary education. Not having Luxembourg citizenship is also a common attribute of high risk groups. In the youngest age group, high risks additionally concern children in female-headed, lone parent households.
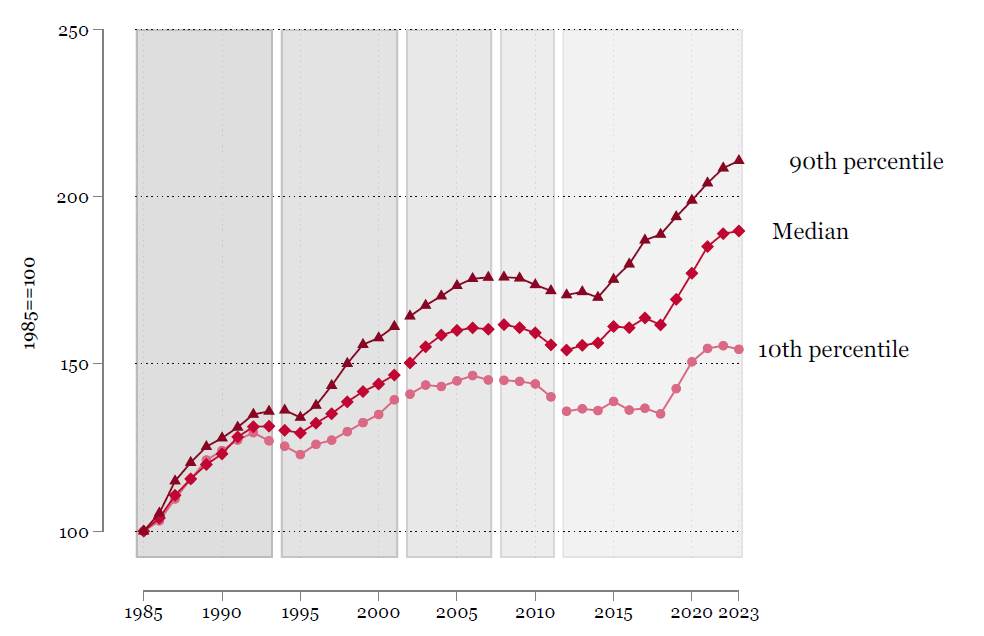
The increase in relative poverty reflects the fact that incomes at the lower end of the distribution have not kept pace with those at the top. This widening gap is evident in the evolution of income percentiles shown in Figure 4, which shows faster growth in the upper decile compared to the lower one. While the bottom decile increased by a remarkable 50 percent since 1985, the median increased by 90 percent and the upper percentile increased by 110 percent over the same period.
Figure 4 – Evolution of low, middle and upper percentiles of the income distribution
A simple simulation illustrates how rising median living standards – and consequently of poverty threshold – have been driving the growth in relative poverty. In Figure 5, the relative poverty line (circles) replicates the trend shown in Figure 1. The 1985 poverty line (diamonds) represents a counterfactual scenario in which the poverty threshold is anchored to the 1985 median income and adjusted only for inflation afterwards. The 2010 poverty line (triangles), diverging from the relative poverty line in 2010, shows the evolution of poverty if the threshold had been frozen in 2010 and similarly adjusted for inflation.
Under the 1985-anchored scenario, the poverty rate would have declined sharply. Anchoring to threshold to the 2010 median would also yield a lower poverty rate. The 2010-anchored poverty rate briefly exceeded the observed relative poverty rate in 2012–2013, when the median temporarily fell following the Great Recession. This episode illustrates how volatile relative poverty measures can be during downturns. By 2023, only 10% of the population falls below the 2010-anchored threshold, well below the contemporaneous poverty rate.
Figure 5 – Trends in relative poverty rates with actual and counterfactual poverty lines anchored at their 1985 and 2010 levels
Between 1985 and 2023, households have become smaller: the share of individuals living alone has increased by 11 percentage points(pp.), and the share living in couples without children by 7pp. The share of individuals living in a female-headed household has risen by 24pp. There has been an increase of 22pp. in the share of individuals living in a household whose head does not have Luxembourgish citizenship, while the share living in a household whose head has no tertiary education has fallen by 43pp. Some attributes associated with higher poverty have increased but at the same time attributes related to low poverty has also increased, notably the prevalence of tertiary education. So on balance, what is the weight of the change in the population structure on the overall trends in poverty?
To try and answer this question, we re-estimated measures of poverty under a scenario in which the population shares were fixed at the values observed in 2020. Those results are displayed in Figure 6. The increase over time in poverty rates would have been much smaller had the population structure not changed. In the absence of population change, there would have been hardly any increase in the total population poverty rate from the 1990s through to the current period. The poverty rate among young people would also have largely been flat, barring an uptick in 2010. The decline in the poverty risk of the elderly residents is still observed in spite of the evolution of the population structure. Clearly, the change in the composition of the population has been a key mechanical driver of the evolution of relative income poverty.
Figure 6 – Counterfactual poverty rates at fixed 2020 population composition
Examination of the LIS series for Luxembourg confirms that sharp increases in indicators of (relative) poverty and sustained growth in living standards can coexist. The doubling of the poverty rate between 1985 and 2023 does not depict a deterioration of the absolute living standards of the low income population, but instead a race between the bottom and the middle – a race that the bottom tends to lose. The evolution is also fueled by large demographic change. Underlying the trends are however persistently large differences in poverty risks across population groups, with children and lone-parent families particularly exposed.
![]()
Watch the video here.
Stay tuned for the forthcoming LISER policy brief, which will present the analysis and cross-country comparison in detail.
| STATEC (2025), Rapport Travail et Cohésion Sociale, STATEC, Luxembourg. |