Issue, No.36 (December 2025)
The Impact of 2021 PPPs on LIS Indicators
In May 2024, the International Comparison Program (ICP) released a revised set of Purchasing Power Parity (PPP) rates for the year 2021 (World Bank, 2024). This release is part of the ICP’s ongoing global effort to measure relative price levels across countries and to support more accurate and consistent international comparisons. Although market exchange rates can convert incomes into a common currency, they fail to account for differences in domestic price levels. PPPs address this limitation by adjusting for variations in the cost of living and reflecting the real purchasing power of national currencies, thereby providing a more meaningful basis for comparing living standards across countries.
Computing PPP rates is a highly complex endeavor, not only technically but also in terms of international coordination. For this reason, the ICP releases PPP updates in multi-year rounds. The most recent round, covering PPPs for 2021, was released in May 2024; the previous round, covering 2017 and revising the 2011 PPPs, was published in 2020. Although the 2021 PPPs were produced using the same core methodology1, as earlier rounds, the ICP implemented enhanced data-collection procedures and other methodological refinements aimed at improving overall data quality.
In this article, we begin by examining the revisions in the PPP rates and the evolution in the Consumer Price Index (CPI) across all countries present in LIS. This provides context for the subsequent analysis, which focuses on the implications of adopting a new base year and incorporating the revised PPP values on LIS estimates. In particular, we concentrate on a single indicator, median income, and examine how it varies both across alternative specifications and across countries. These results provide LIS users with an initial benchmark against which they can assess the effects of updating their own estimates to the most recent base year.
Changes in PPP and CPI in LIS Countries
Figure 1 presents two measures of price variation for every country in the LIS database2. The vertical bars show the percentage change between each country’s 2021 PPP rate and its corresponding value from the previous ICP round expressed in 2017 base-year prices. The dots show the rate of change in the Consumer Price Index (CPI) over the same period.
As stated in (Jolliffe et al., 2024) “PPPs measure how much it costs to purchase a basket of goods and services in one country compared to how much it costs to purchase the same basket of goods and services in the United States”. A positive PPP variation therefore indicates that a country has become relatively more expensive compared with the benchmark country, in this case the United States. Conversely, if PPPs are revised downwards, fewer units of the local currency (e.g., euros, yen, Mexican pesos) are required to match the purchasing power of one U.S. dollar spent in the United States, meaning the country has become relatively cheaper.
It is important to note however, that changes in PPPs from one round to another, may reflect more than real shifts in relative purchasing power between two countries. They can also arise from statistical adjustments to expenditure weights, improvements in data collection, or even from the composition of the representative basket of goods and services. As a result, PPP movements do not always map directly into the day-to-day economic reality of households between 2017 and 2021.
Figure 1: Variation in PPP and CPI Between 2017 and 2021 – LIS Countries
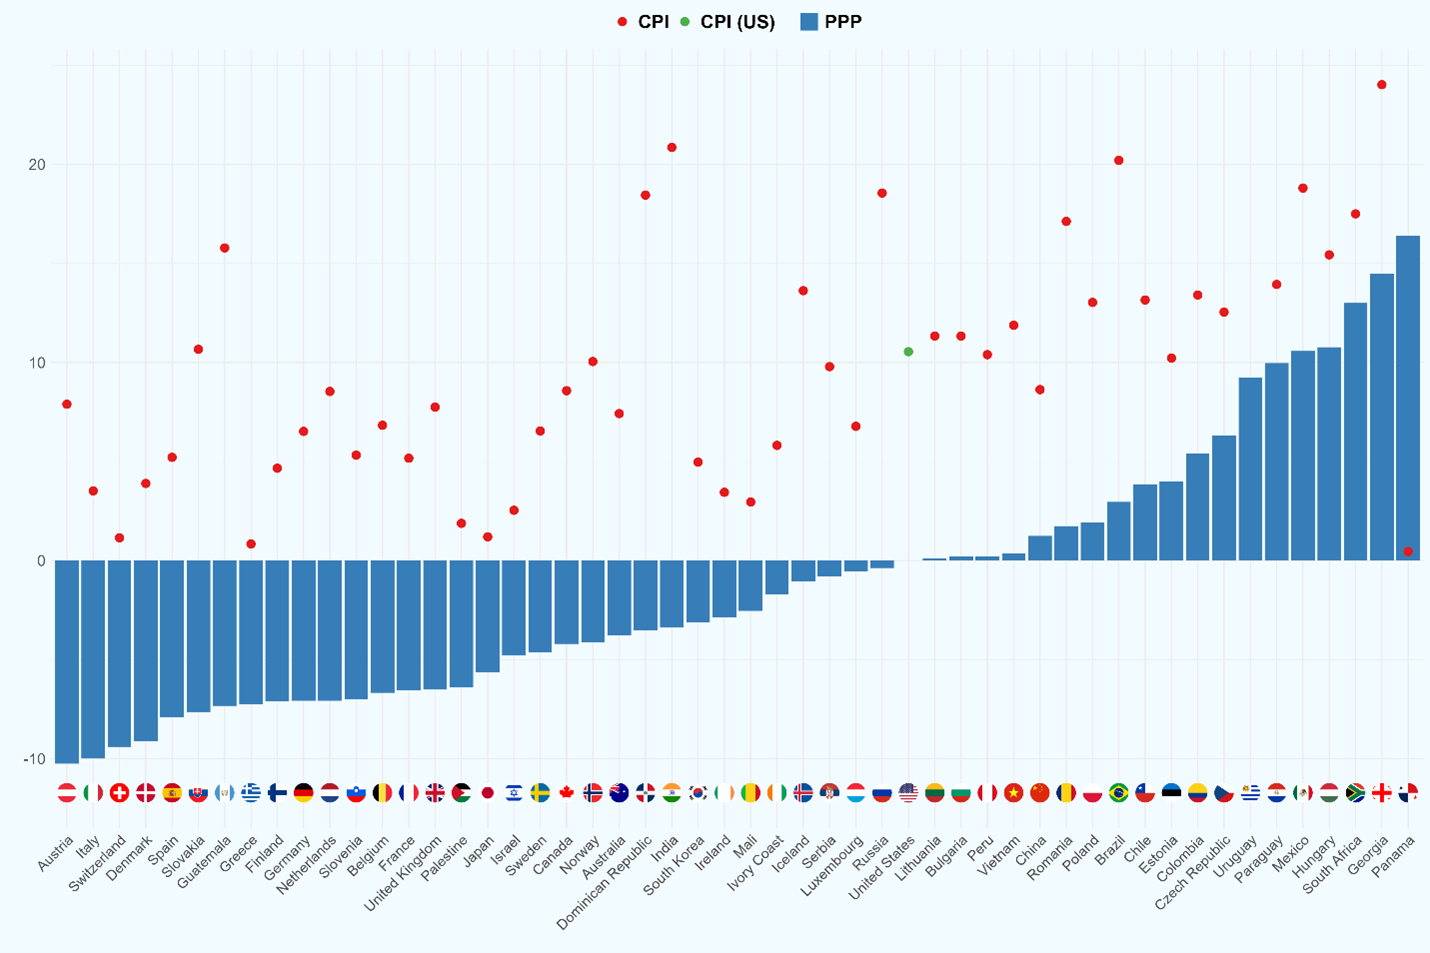
Note: For scaling purposes, the data point for Uruguay’s inflation rate between 2017 and 2021 (37.3%) has been omitted. In the United States, it was 10.5%, while for countries with positive PPP variation, the average inflation rate was 14.8%. By contrast, countries with negative PPP variation experienced a lower average inflation rate of 7.41%.
Source: World Bank.
Nonetheless, it is possible to observe that, on average, countries with upward revisions in their PPP values exhibited higher inflation rates than the United States, while those with declining PPPs generally experienced lower inflation. From a geographical perspective, the countries that became relatively cheaper compared with the United States are predominantly located in Western and Northern Europe. In contrast, the largest relative price increases are observed among South American countries and among Central and Eastern European countries outside the euro area3.
Finally, all countries with no exception experienced positive inflation between 2017 and 2021. This implies that a nominal unit of currency in 2021 purchased less in real terms than the same amount did in 2017.
Impact of Base-Year and PPP Revisions on Median DHI
For the remainder of this article, our aim is to illustrate what LIS users can expect when updating their estimates using the new base year and the newly released PPP values. To do so, we rely on the most recent datasets available in LIS for all high and upper middle-income countries (except Taiwan; see footnote 2), provided that their latest data point is from 2020 onwards. Our variable of interest is equivalized disposable household income, derived from household-level datasets, and prepared following the same procedures used to compute the LIS Inequality Key Figures4.
Before turning to the results, it is essential to clarify two aspects. First, the following analysis is time-fixed: one country, one year. The changes we document must therefore not be interpreted as trends or developments in median income over time. Instead, they show how the value of each indicator would differ solely as a result of using a different base year or PPP round.
Second, modifying the PPPs or changing the base year imposes a monotonic transformation on the underlying microdata. In practical terms, this shifts the entire income distribution for a given country-year to the right or left5, while leaving the shape of the distribution unchanged. Consequently, inequality indicators such as the Gini coefficient, percentile ratios, or the relative poverty rate remain unaffected.
By contrast, indicators expressed in international dollars to allow comparisons across countries, are naturally affected by these transformations. This includes monetary measures such as average income and income percentiles (e.g., the median), as well as absolute poverty rates, when they rely on a poverty threshold expressed in international dollars. For these indicators, revisions to the base year and the PPP round can materially alter cross-country comparisons.
In Figure 2, we plot the median equivalized disposable household income for each country-year pair across three distinct base years and PPP rounds. A clear pattern emerges: median values generally increase as the base year is updated to a more recent year. For the United States, which serves as the benchmark country, the variation across specifications aligns exactly with the evolution of the CPI. Since inflation was positive in all countries between 2017 and 20216, it is unsurprising that nominal values tend to increase when the base year is updated. The pattern is not universally guaranteed, however, Sweden being one of the exceptions. In all countries, excluding the US, part of the variation is also driven by changes in their PPPs, which explains why some countries are more affected than others.
In particular, some South American countries experienced high inflation over this period, yet updating the base year from 2017 to 2021 did not result in correspondingly large increases in median income expressed in international dollars. This is due to a relative ‘penalization’ effect: their incomes lost purchasing power compared with the United States, so when converted into international dollars, the impact of both the base-year change and their high inflation is noticeably muted.
The different exposures of countries to inflation and to PPP revisions lead to varying degrees of change in the estimates plotted in Figure 2, as described above. Because of this, even though our analysis is static in time and the underlying household incomes remain unchanged, notable shifts in cross-country rankings can still be observed. Figure 3 shows these shifts and makes it possible to see which countries move ahead of others under each specification.
Figure 2: Equivalized Median DHI – international $
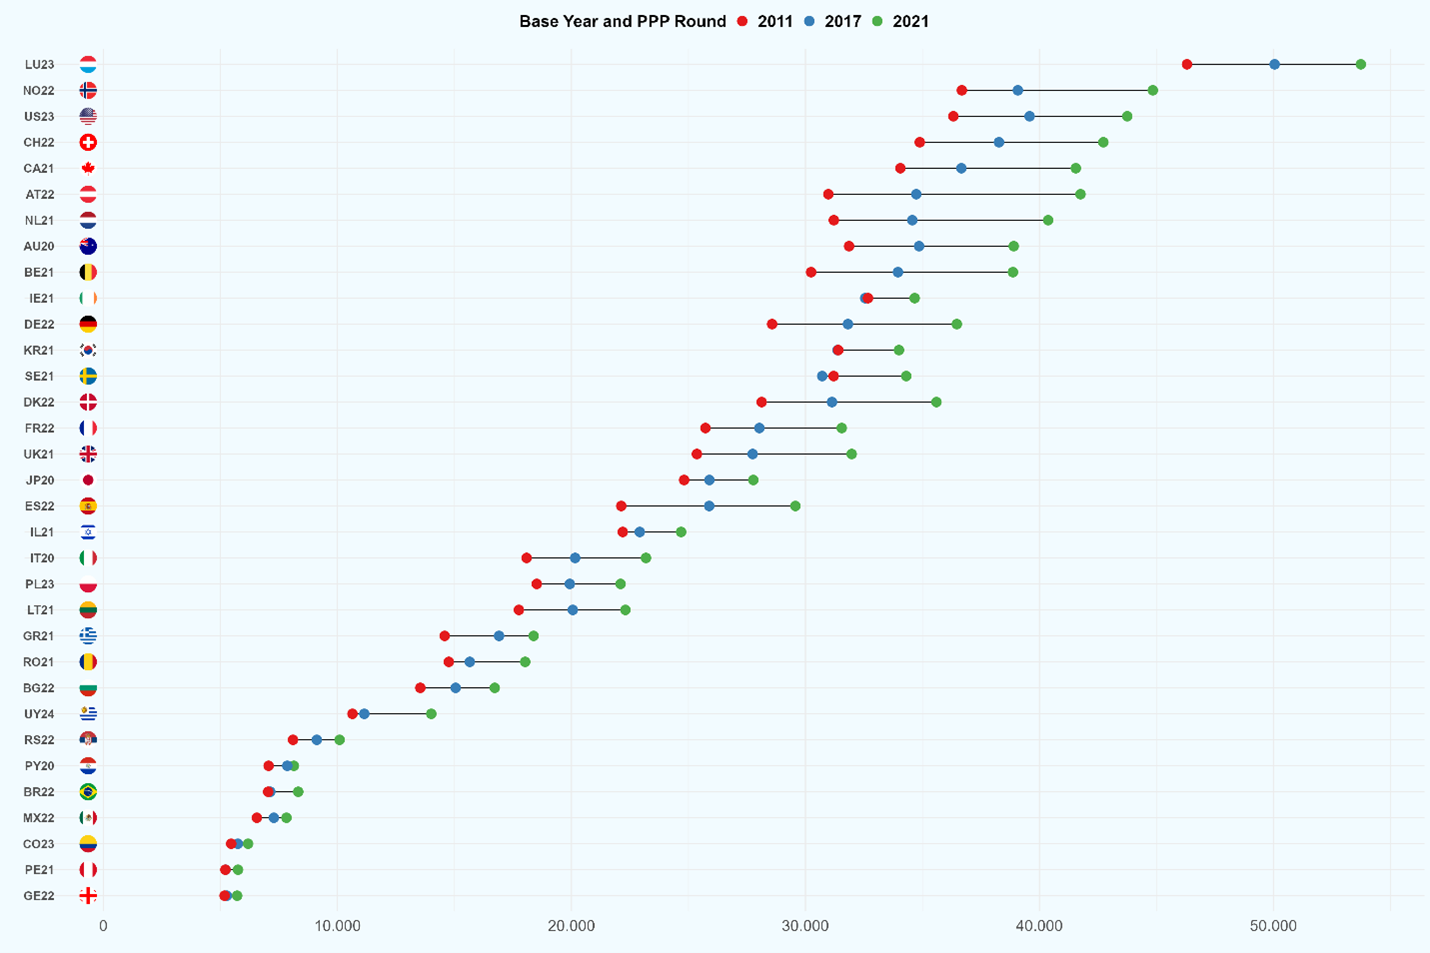
Note: PPP values for 2011 remain available on the LIS website. Households with missing values were excluded from the sample. Income was top- and bottom-coded to remove outliers and equivalized using the square-root scale. See footnote 4.
Source: Luxembourg Income Study (LIS).
Countries with large downward revisions in their PPP rates, such as Austria and Denmark, now receive a more favorable conversion into international dollars, improving their position relative to the other countries in LIS. The opposite occurs for countries like Ireland and South Korea. Brazil illustrates yet another case. Although its PPP increased by nearly 3%, this rise was modest compared with Mexico and Paraguay, whose PPPs grew roughly 10–11%. As a result, Brazil surpasses both countries when 2021 is used as the base year to adjust the median disposable household income (DHI). These examples highlight that the exercise is far from innocuous, as the choice of base year and PPP round can substantially influence how countries compare with one another.
Figure 3: LIS Ranking – Equivalized Median DHI – international $
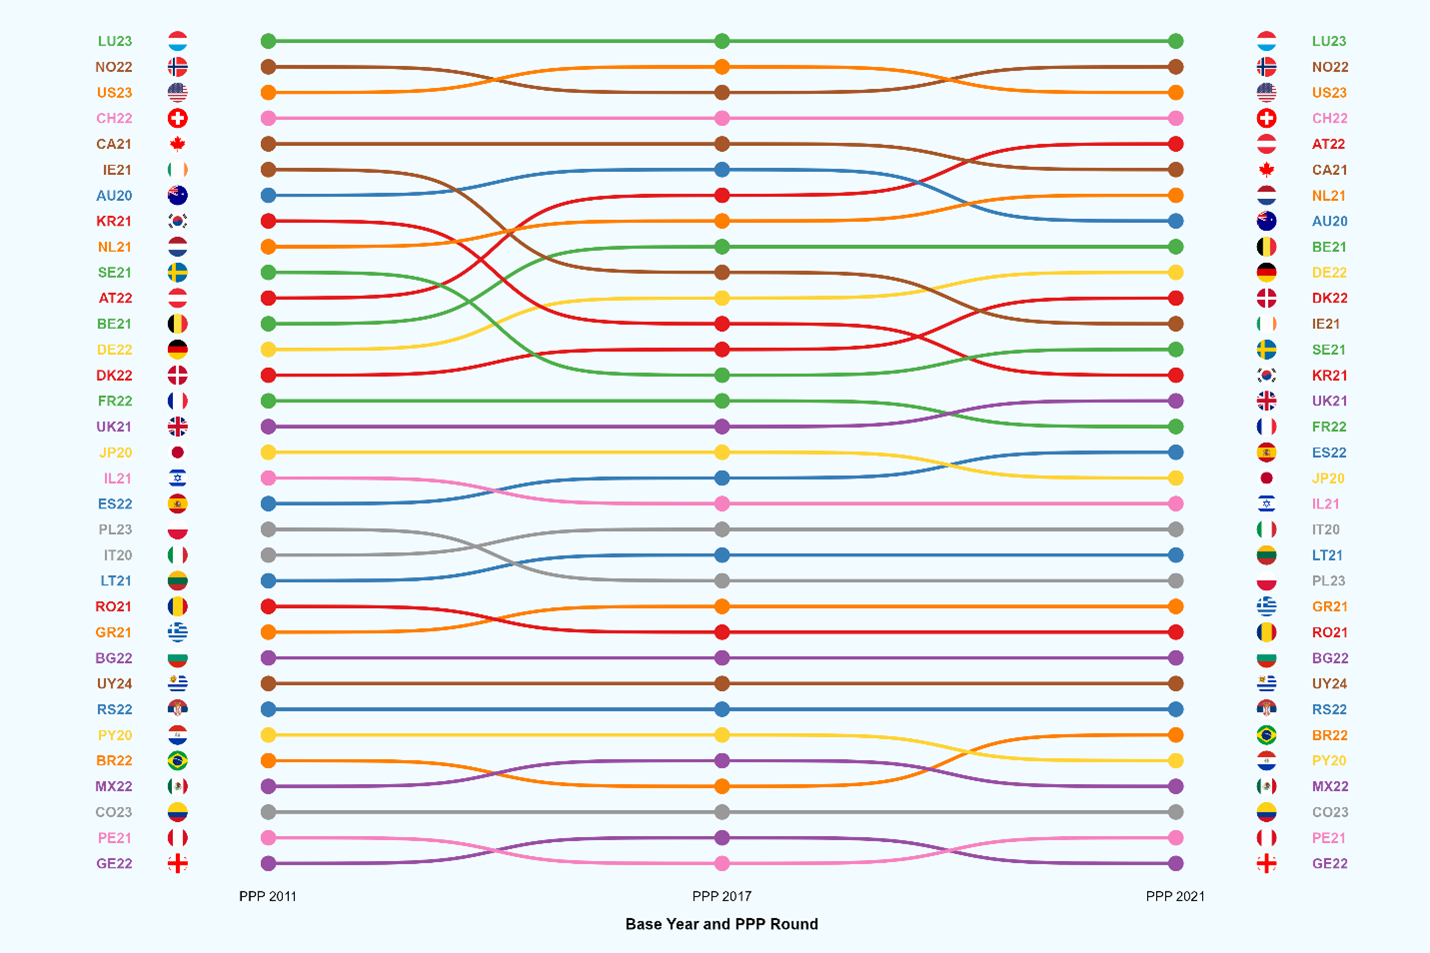
Source: Luxembourg Income Study (LIS).
This article is a shortened version of LIS Technical Working Paper No. 15, which also examines the World Bank’s recent increases in the International Poverty Lines. It further assesses their impact on absolute poverty rates, together with the effects of rebasing incomes from 2017 to 2021 and applying the newly released PPPs discussed in this article.
1 According to the ICP, three main developments were nevertheless implemented; (i) CIS treated as a sixth core region; (ii) hybrid housing-PPP method for Asia–Pacific; and (iii) regression-based PPP imputations for non-participating economies.
2 The ICP database compiling the PPP rates, does not contain figures on Taiwan.
3 The Baltic nations of Estonia and Lithuania, are members of the euro area since 2011 and 2015, respectively.
4 LIS Inequality Key Figures are expressed in national currency units. See all the data preparation steps here.
5 Reflecting a change in the units of measurement (local currency converted into international dollars prices).
6 Between 2011 and 2017 only two countries experienced a decline in their CPI: Greece (-2.20%) and Switzerland (-1.96%).
References
| Jolliffe, D., Mahler, D.G., Lakner, C., Atamanov, A., Tetteh-Baah, S.K., (2024). Poverty and Prices: Assessing the Impact of the 2017 PPPs on the International Poverty Line and Global Poverty. Policy Research Working Paper 9941. World Bank, Washington, D.C. |
| World Bank (2024). Purchasing Power Parities and the Size of World Economies: Results from the International Comparison Program 2021. World Bank, Washington, D.C. |
Recommended Readings
| Foster, E.M., Jolliffe, D., Ibarra, G.L., Lakner, C., Tetteh Baah, S.K. (2025). Global Poverty Revisited Using 2021 PPPs and New Data on Consumption. Policy Research Working Paper 11137. World Bank, Washington, D.C |
| Rohenkohl, B., Hasell, J., Arriagada, P., Ortiz-Ospina, E. (2025) – “What are international dollars?” Published online at sadfasdfadOurWorldinData.org. Retrieved from: ‘https://ourworldindata.org/international-dollars’ [Online Resource] |
| Baah, S. K. T., Foster, E., Jolliffe, D. M., Lakner, C., & Lara Ibarra, G. (2025, June 9). “The World Bank’s new global poverty lines in 2021 prices”. Published online at World Bank Data Blog. Retrieved from: ‘https://blogs.worldbank.org/en/opendata/the-world-bank-s-new-global-poverty-lines-in-2021-prices’ [Online Resource] |
| Filmer, D., Fu, H., & López-Calva, L. F. (2025, June 5). “Further strengthening how we measure global poverty”. Published online at World Bank Data Blog. Retrieved from: ‘https://blogs.worldbank.org/en/voices/further-strengthening-how-we-measure-global-poverty’ [Online Resource] |