![]()
Issue, No.36 (December 2025)
Childless households and relative income poverty outcomes: a cross-country comparison
1 2
Introduction
A large body of research on income poverty has placed households with children at the centre stage. Childless households, however, have received far less attention despite their growing share of the population and rising poverty risks, particularly among singles (Alm et al., 2020; Brady & Parolin, 2020; Edmiston et al., 2025; Gornick et al., 2024; Kreyenfeld & Konietzka, 2017; Parolin, Desmond & Wimer, 2023).
This emphasis on households with children is understandable: children are more vulnerable to poverty (Minujin et al., 2006), and child poverty has long-term consequences on individual development (Cooper & Stewart, 2020). Moreover, high poverty rates among single parents have reasonably drawn sustained attention towards this specific demographic (Brady & Burroway, 2012; Maldonado & Nieuwenhuis, 2015; Van Lancker et al, 2015). Equally important, however, social policy research has focused on this group because an increasing number of anti-poverty measures specifically target households with children (Ferragina & Seeleib-Kaiser, 2014; Frericks & Gurìn, 2023; Morgan, 2013; Thévenon, 2011). Still, this emphasis has often obscured the limited support available to childless households and how these policies may increase inequalities between households with and without children.
In this sense, evidence shows that existing welfare systems – particularly when strongly geared towards targeting – fail to adequately support low-paid childless individuals, particularly singles (Alm et al., 2020; Edmiston et al., 2025; Gornick et al., 2024). For the United States, Parolin et al. (2023) show that the shift towards greater categorical targeting, particularly in tax credits, has improved the position of households with children, while leaving childless households behind. Social benefits have also remained relatively lower for childless households, contributing to a rise in deep poverty among this demographic, while this has fallen among households with children (Brady & Parolin, 2020; Parolin & Brady, 2019). Gornick et al. (2024) also show that – next to generally low levels of social assistance for this group – the federal minimum wage is insufficient to keep low-paid and non-working childless individuals out of poverty.
None of these existing studies, however, has assessed relative poverty rates among this group from a large cross-country perspective. In this short note, we fill this gap, by analysing poverty outcomes among working-age childless households across twenty countries in Europe and North America for the year 2019; we do so by employing harmonised data from the Luxembourg Income Study (LIS) Database. We adopt a specific focus on the U.S. as an archetypal case of a tax-transfer system that over the last few decades has shifted toward increased targeting to specific groups, including households with children. To maximise the number of cases, we choose 2019 as the most recent data point with sufficient country-level data on the LIS database. Our sample includes countries that profoundly differ with respect to income protection and labour market characteristics. In terms of sample selection, we include only respondents of working-age (aged 25-59).
Our goal is to assess how childless adults – defined as those who do not reside with dependent children under age 18 – fare in terms of relative income poverty across distinct welfare systems, and how distinct tax-transfer systems compare with the U.S. in reducing poverty among this group. We also examine cross-country differences in poverty rates among distinct demographic groups within childless households and contrast these outcomes with those of households with children.
Findings
Post-tax-post-transfer poverty
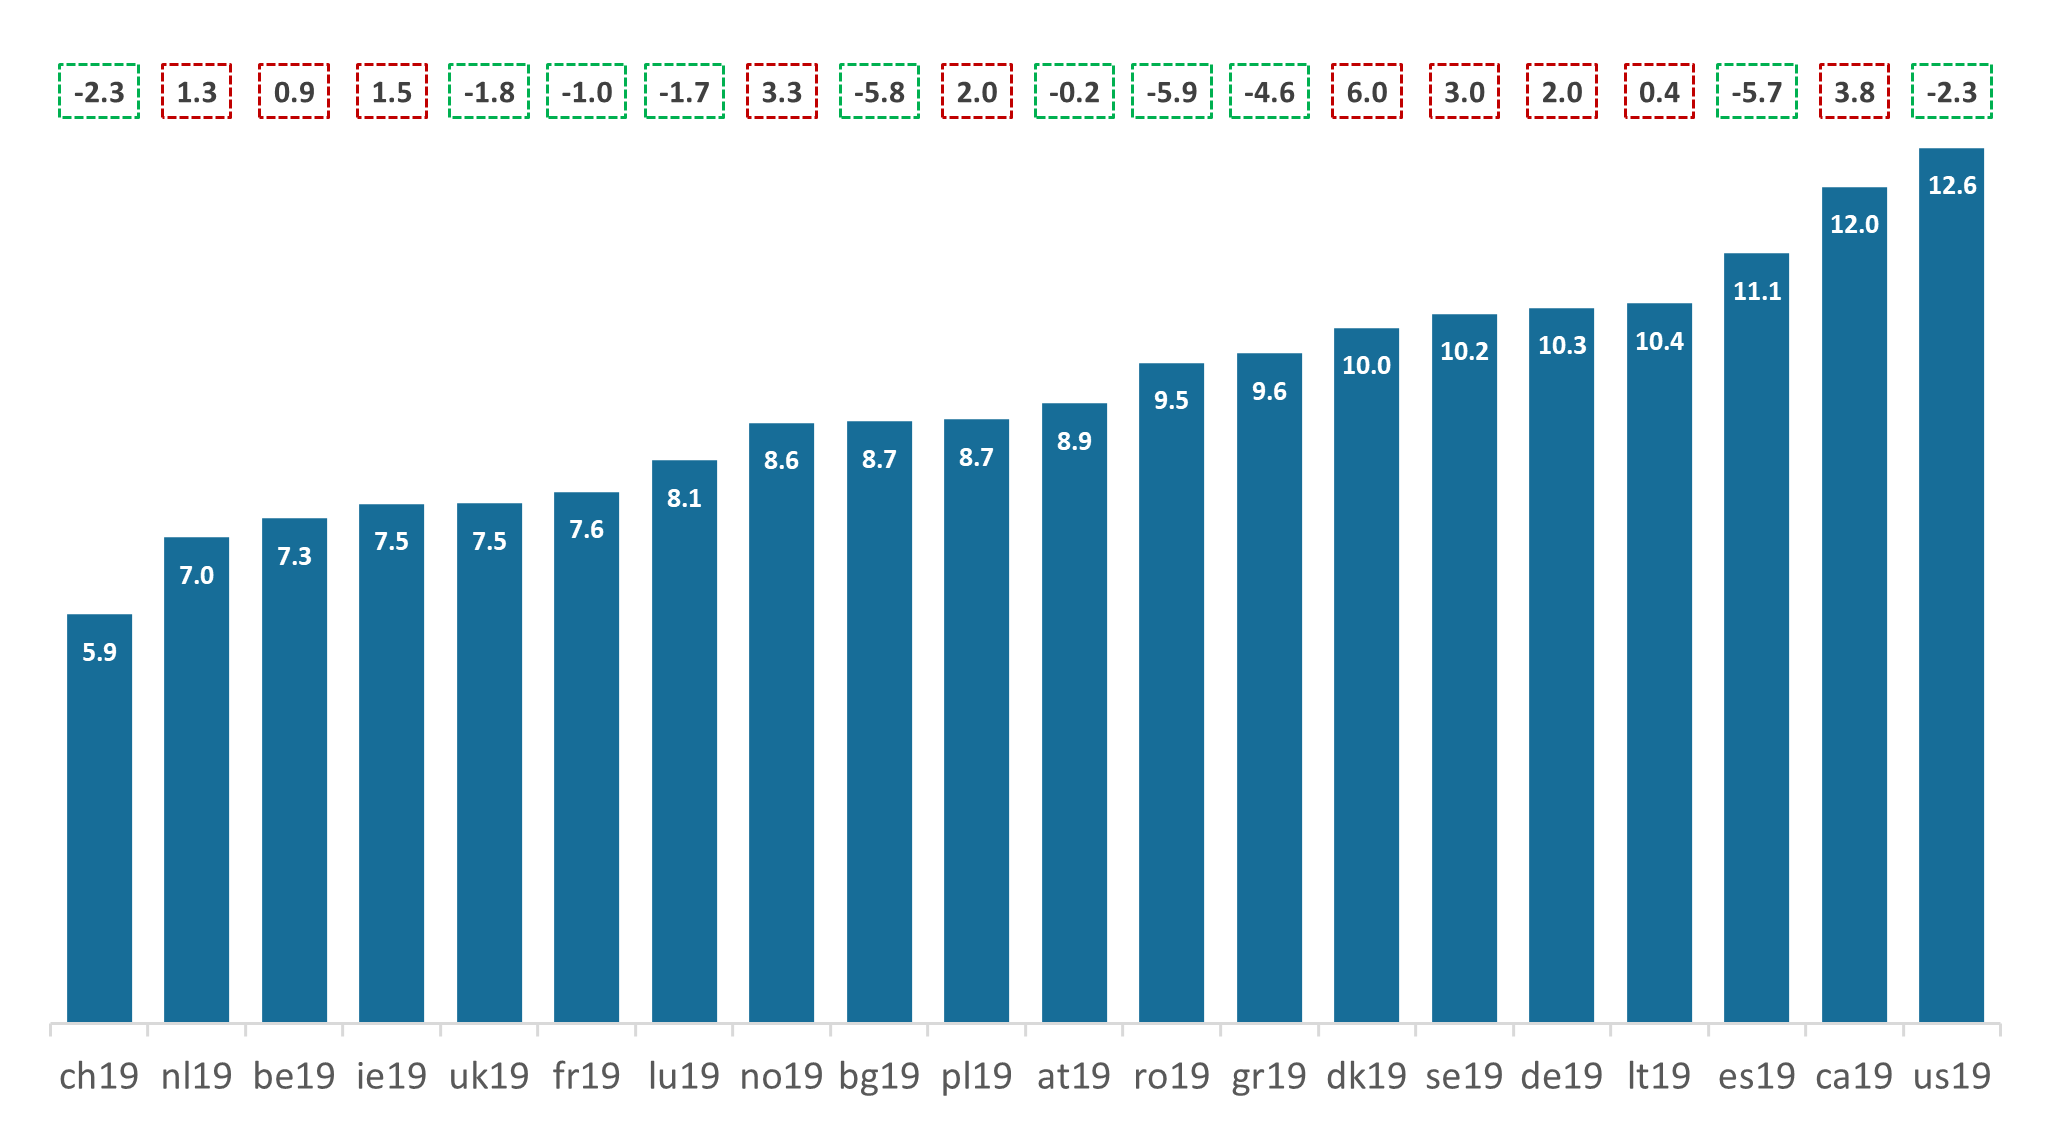
The United States stands out for its high poverty among childless households: 12.6% of working-age individuals living in childless households are poor3 – the highest poverty incidence among the twenty countries analysed (Figure 1). Notably, this rate is more than double that of Switzerland (5.9%), the best-performing country, indicating large cross-national disparities.
Childless households in the U.S., however, have a lower poverty rate than households with children (-2.3pp). This pattern is far from universal: at least in six countries – Denmark (+6pp), Canada (+3.8pp), Norway (+3.3pp), Sweden (+3pp), Poland (+2pp), and Germany (+2pp) – childless households are significantly more exposed to poverty. Remarkably, the U.S. ranks among the countries where childless households fare better relative to households with children – only Romania (-5.9pp), Bulgaria (-5.8pp), Spain (-5.7pp), and Greece (-4.6pp) show larger gaps.
Figure 1. Poverty rate (%), difference between childless and non-childless (pp), Post-tax-post-transfer, Childless households, Working-age population, by country, 2019
Source: LIS Database
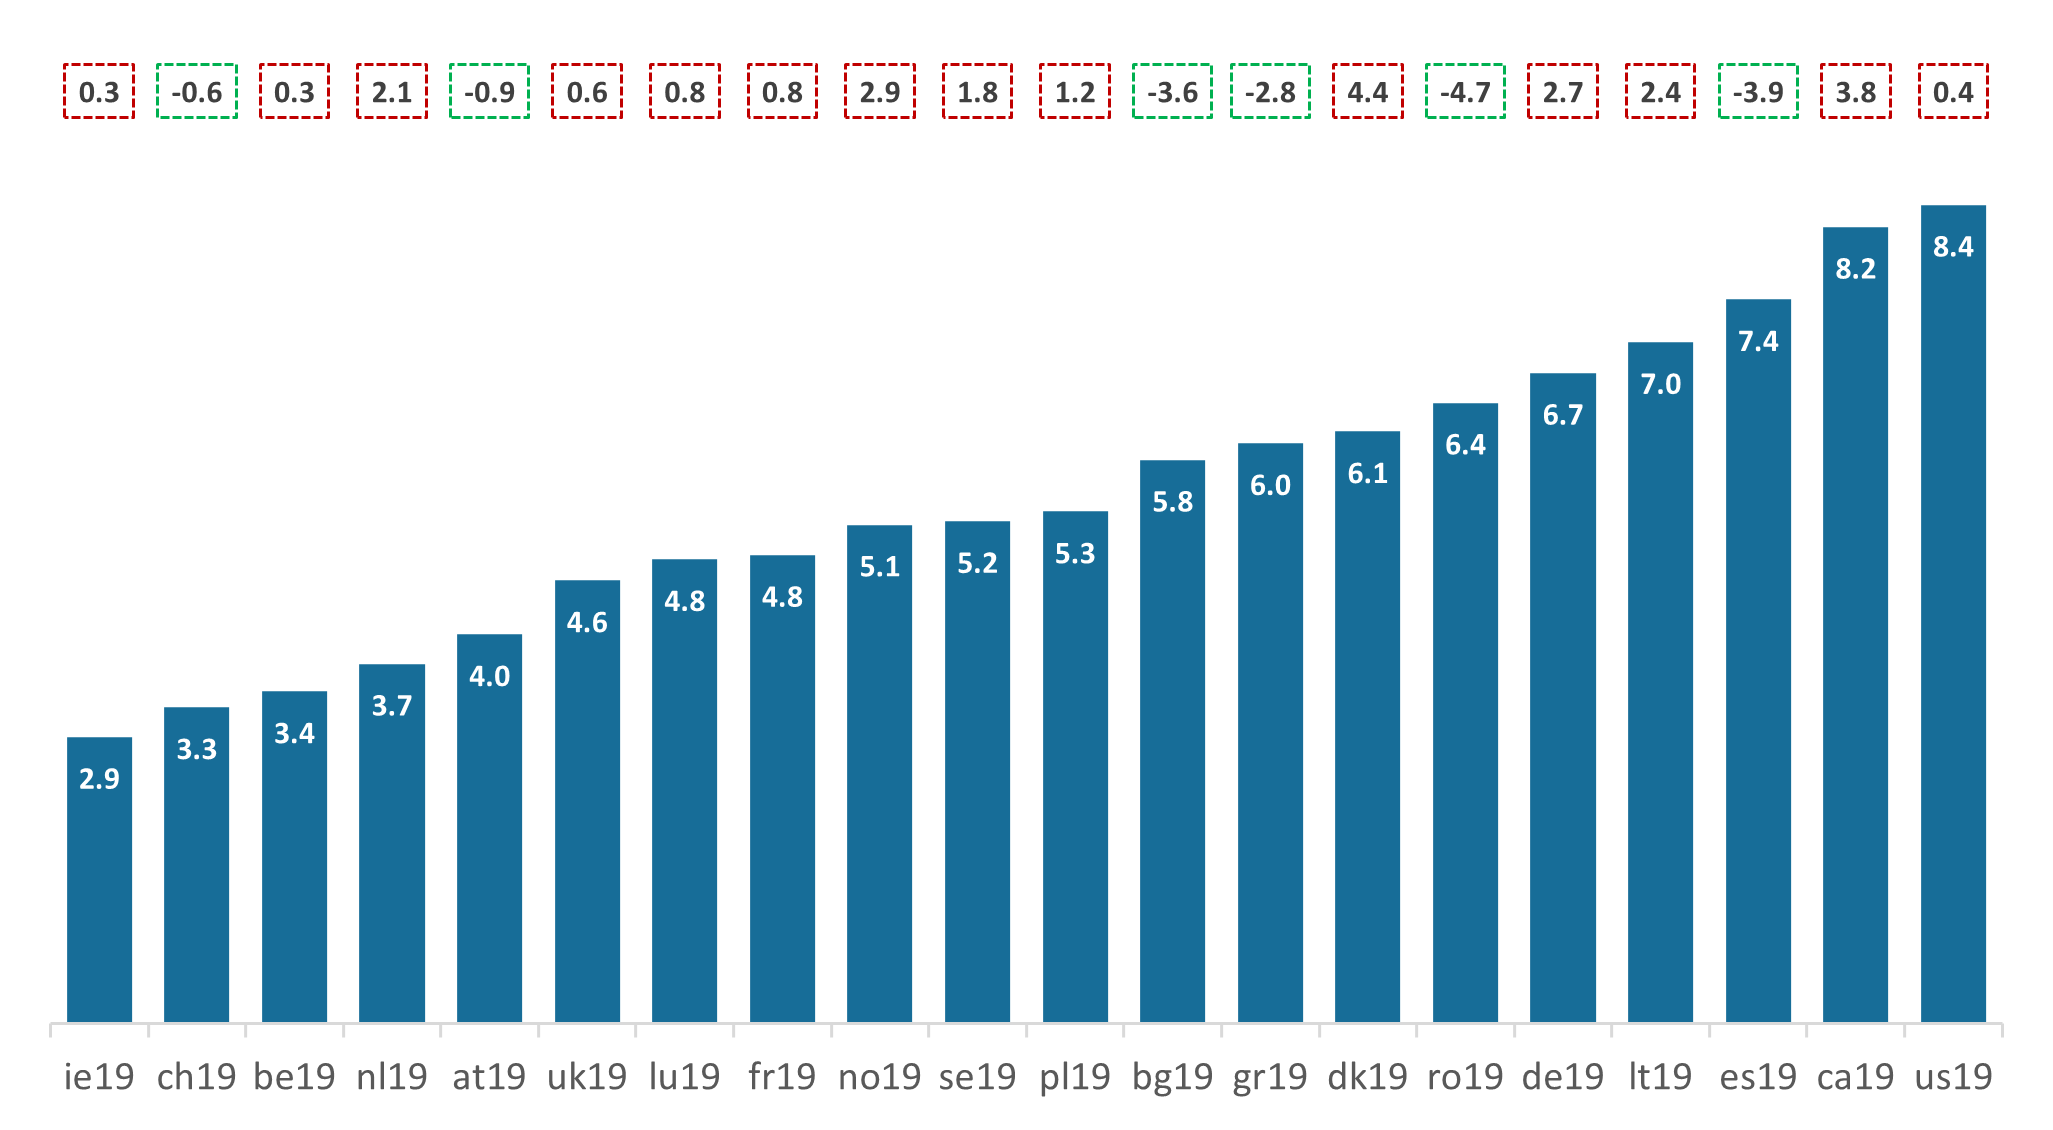
Deep poverty reveals a starker divide. When this is defined as having an income below 40% of the median equivalised household income, the United States records the highest rate among childless households (8.4%, Figure 2). This is more than twice the deep poverty rate of top performing countries, such as Ireland (2.9%), Switzerland (3.3%), Belgium (3.4%), the Netherlands (3.7%), and Austria (4%).
Unlike the standard poverty measure, deep poverty in the U.S. is slightly higher among childless households than among households with children (+0.4pp). A similar pattern emerges in the United Kingdom, France, and Luxembourg, where childless households face relatively higher deep poverty despite lower poverty rates under the 50% threshold.
Figure 2. Deep poverty rate (%), difference between childless and non-childless (pp),Post-tax-post-transfer, Childless households, Working-age population, by country, 2019
Source: LIS Database
Employment status is the strongest predictor of poverty among childless households (Table 1). Non-employed individuals are three times more likely to be poor than the group average – and up to four times in Germany, the United Kingdom, and Norway. The United States ranks second only to Germany, with rates nearly three times the group mean. In Romania, Greece, and Spain the gap is smaller but significant, at roughly twice the average. By contrast, being employed, is associated with a lower poverty rate. Employed individuals are more than twice as unlikely to be poor, compared to the group average. Still, this is less the case in some countries, such as Romania, Switzerland and Germany.
Being single is another strong predictor of poverty among the childless, with gender being a key factor. The United States has the highest poverty incidence among single women in childless households (19.4%), 3.4pp higher than for single males. Only in Canada is the poverty rate for single females proportionally larger relative to the group average. By contrast, Lithuania has the highest rate among single men (18.8%). On the contrary, married individuals in childless households are half as likely to be in poverty compared to the average. Such an association is the strongest in Ireland, Denmark, and Lithuania.
Age is also a relevant variable. The United States stands out for having the highest poverty rate among the intermediate (35-54) and oldest age groups (55-59) – respectively 13.1% and 14.9%. By contrast, the Nordic countries have the highest poverty incidences among the younger age group (25-34): in Denmark (19.3%) and Norway (13.7%), but also in Germany (16.1%), poverty among younger adults is twice the average. In Denmark, there is a staggering 15.6pp difference between the youngest and the oldest age groups. By contrast, in Romania, Poland, Ireland, and the United Kingdom, the older age group is twice as poor as the younger age group.
Table 1. Poverty rate (%), Post-tax-post-transfer, by sociodemographic group, Childless households, Working-age population, by country
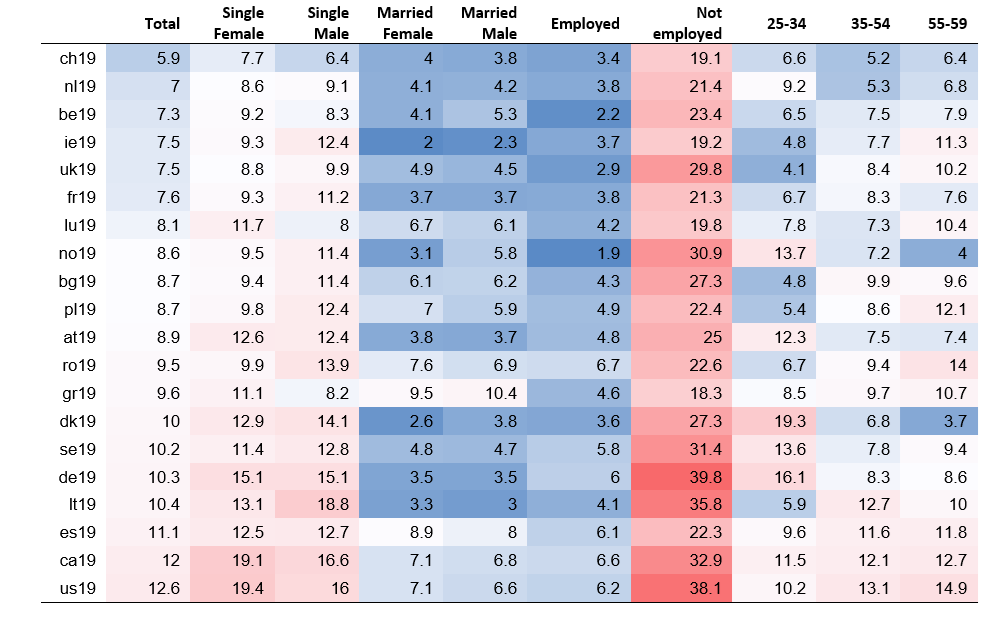
Note: The cell colour indicates where each value falls within the total range of values, with green indicating smaller and red indicating higher poverty rates.
Source: LIS Database
Pre-tax-pre-transfer poverty
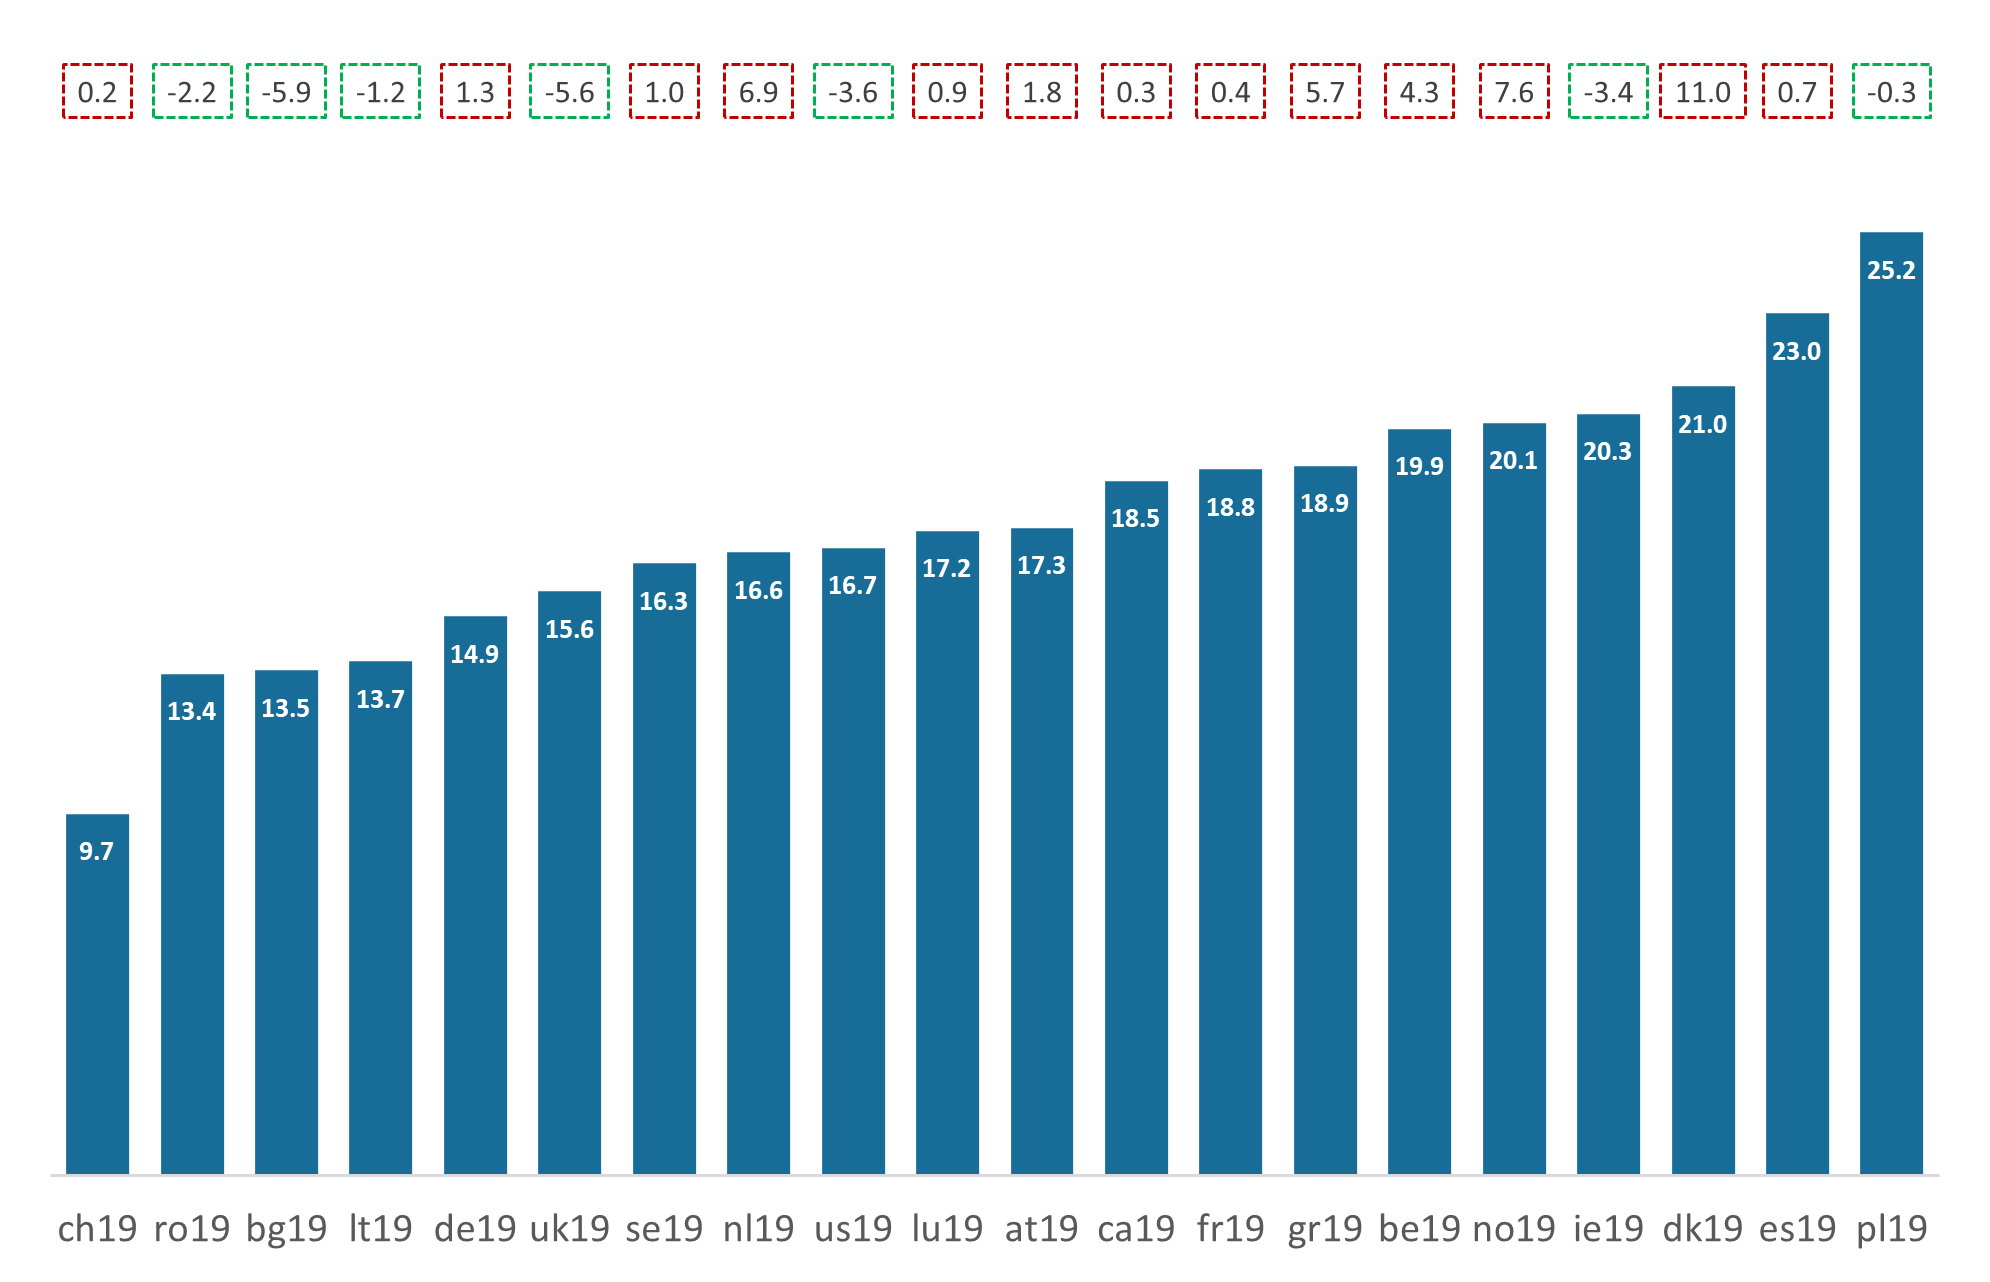
Countries rank much differently when poverty is calculated on household incomes before redistribution The United States (16.7%) sits close to the twenty-country average4, while Poland records the highest pre-tax-pre-transfer poverty rate (25.2%) – over four times Switzerland’s (5.7%), the lowest estimate.
Overall, childless households face worse poverty outcomes than households with children in thirteen countries, underscoring their relative exposure to market-generated poverty. This gap is especially pronounced in Denmark (+11pp), Norway (+7.6pp), and the Netherlands (+6.9pp), with Greece (+5.7pp) and Belgium (+4.3pp) also showing notable differences. By contrast, in Bulgaria (-5.9pp), the United Kingdom (-5.6pp), the U.S. (-3.6pp), Ireland (-3.4pp), Romania (-2.2pp), and to a lesser extent, Lithuania (-1.2pp) and Poland (-0.3pp), childless households have lower pre-redistribution poverty rates. On average, the difference between the two groups is larger before redistribution than after, highlighting the role of the tax-transfer system in narrowing these gaps.
Figure 3. Poverty rate (%), difference between childless and non-childless (pp),Pre-tax-pre-transfer, Childless households, Working-age population, by country, 2019
Source: LIS Database
The poverty-reducing effectiveness of income taxes and transfers
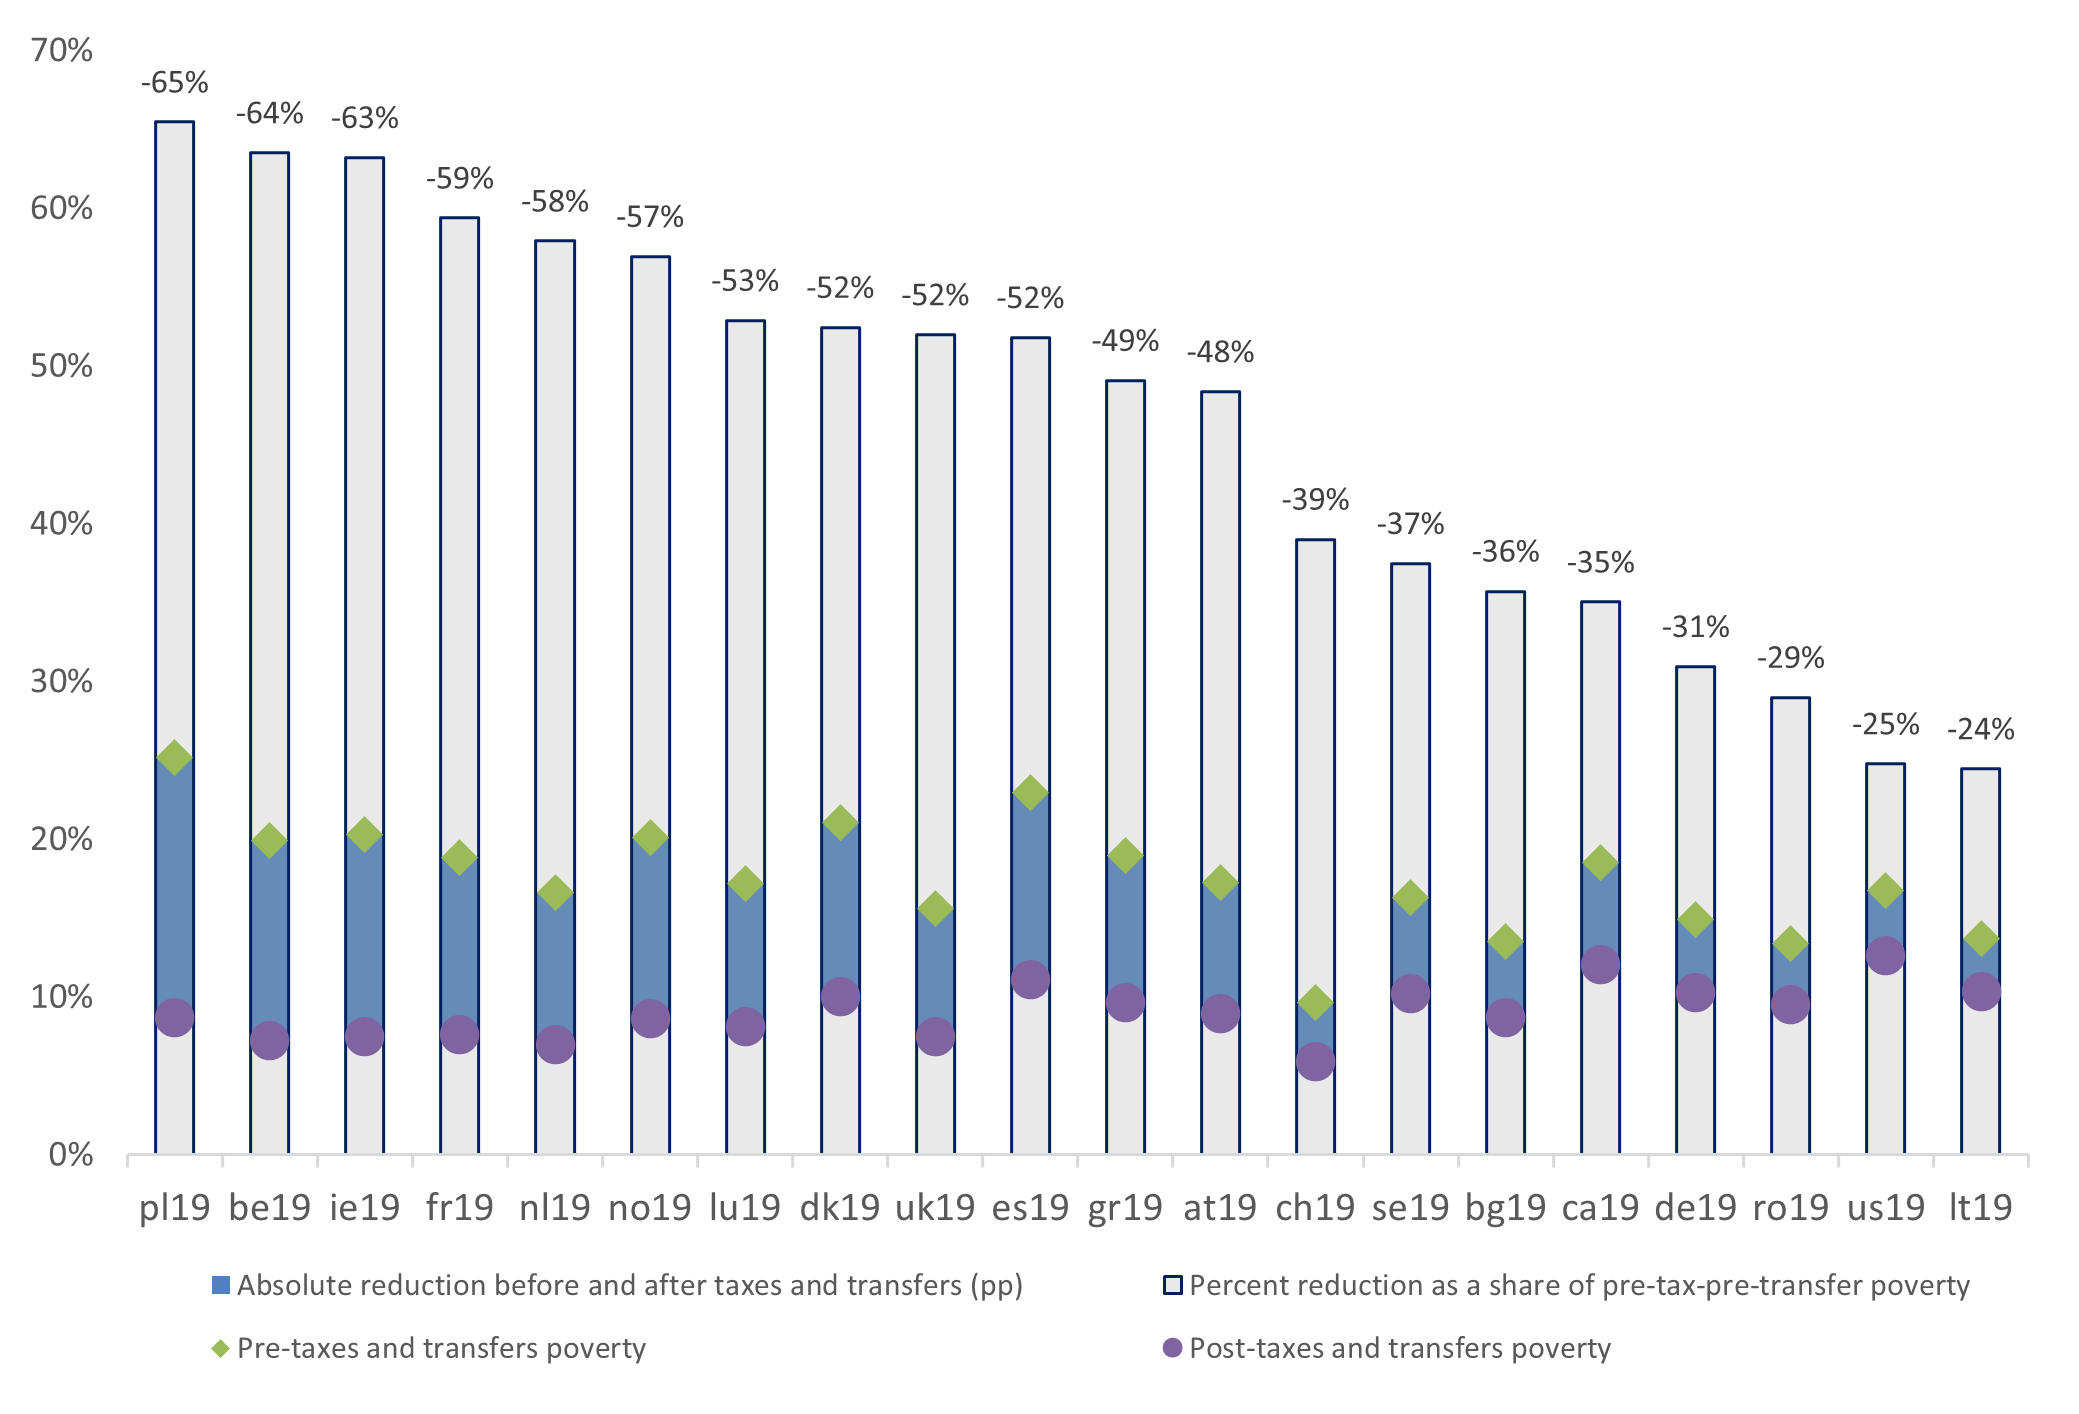
The poverty outcomes described in the previous section highlight that childless households are not systematically less exposed to poverty than households with children. In fact, they are relatively more exposed to poverty in at least half of the countries. When it comes to deep poverty, they are poorer in three cases out of four. The role of the tax-transfer system is central to explaining these gaps. There is indeed great cross-country variation in the degree to which income taxes and transfers reduce market-generated poverty5. We measure a welfare system’s effectiveness in offsetting poverty by looking at the percent reduction in the poverty rate before and after taxes and transfers.
A comparison of this measure across countries (Figure 4) highlights striking differences in the impact of national tax-transfer systems on poverty among childless households. Lithuania (24%) and the United States (25%) reduce poverty the least – only about a quarter of pre-tax-pre-transfer poverty. Every other country achieves a greater reduction, ranging from 30% in Romania and Germany to 65% in Poland and Belgium.
At the lower end of the spectrum, a cluster of countries – including Canada, Bulgaria, Sweden and Switzerland – also reduce poverty by less than 40%, while in all other countries this is reduction is close to or above half of pre-tax-pre-transfer poverty.
Looking at absolute differences (blue bars in Figure 4) among individuals living in childless households, Poland stands out with a -16.5pp reduction, well above the other countries. At the bottom of the ranking, the U.S. (-4.2pp) does only slightly better than Switzerland (-3.8pp) and Romania (-3.9pp), while Lithuania remains the worst-performer with just a -3.4pp reduction.
Figure 4. Percent reduction in poverty,
Childless households, Working-age population, by country, 2019
Source: LIS Database
The extent to which tax-transfer systems reduce pre-tax-pre-transfer poverty varies sharply between households with and without children. In half of our sample, the tax-transfer system is more effective for households with children (Figure 5). This is most evident in Canada (-20pp), Sweden (-15.5pp), and Ireland (-11.6pp), and to a lesser degree in Lithuania (-8.5pp), Germany (-8.4pp), Poland (-8.3pp), and Denmark (-8pp). Even in the United Kingdom (-4.3pp), the United States (-2.2pp) and Norway (-0.5pp) the advantage still leans towards households with children.
When the opposite occurs, however, the gap between the two household groups is more important. In Greece, the poverty reduction for the childless group, for instance, is more than twice the reduction achieved for households with children. Romania (+27.8pp), Spain (+27.2pp), and Switzerland (+25.7pp), also show larger differences than any of the cases favouring households with children. This pattern reveals an important asymmetry: while tax-transfer systems often reduce poverty more for households with children, when the opposite occurs, the gains for childless households are greater.
Figure 5. Difference in percent reduction in poverty (pp),
Childless vs. non-childless households, Working-age population, by country, 2019
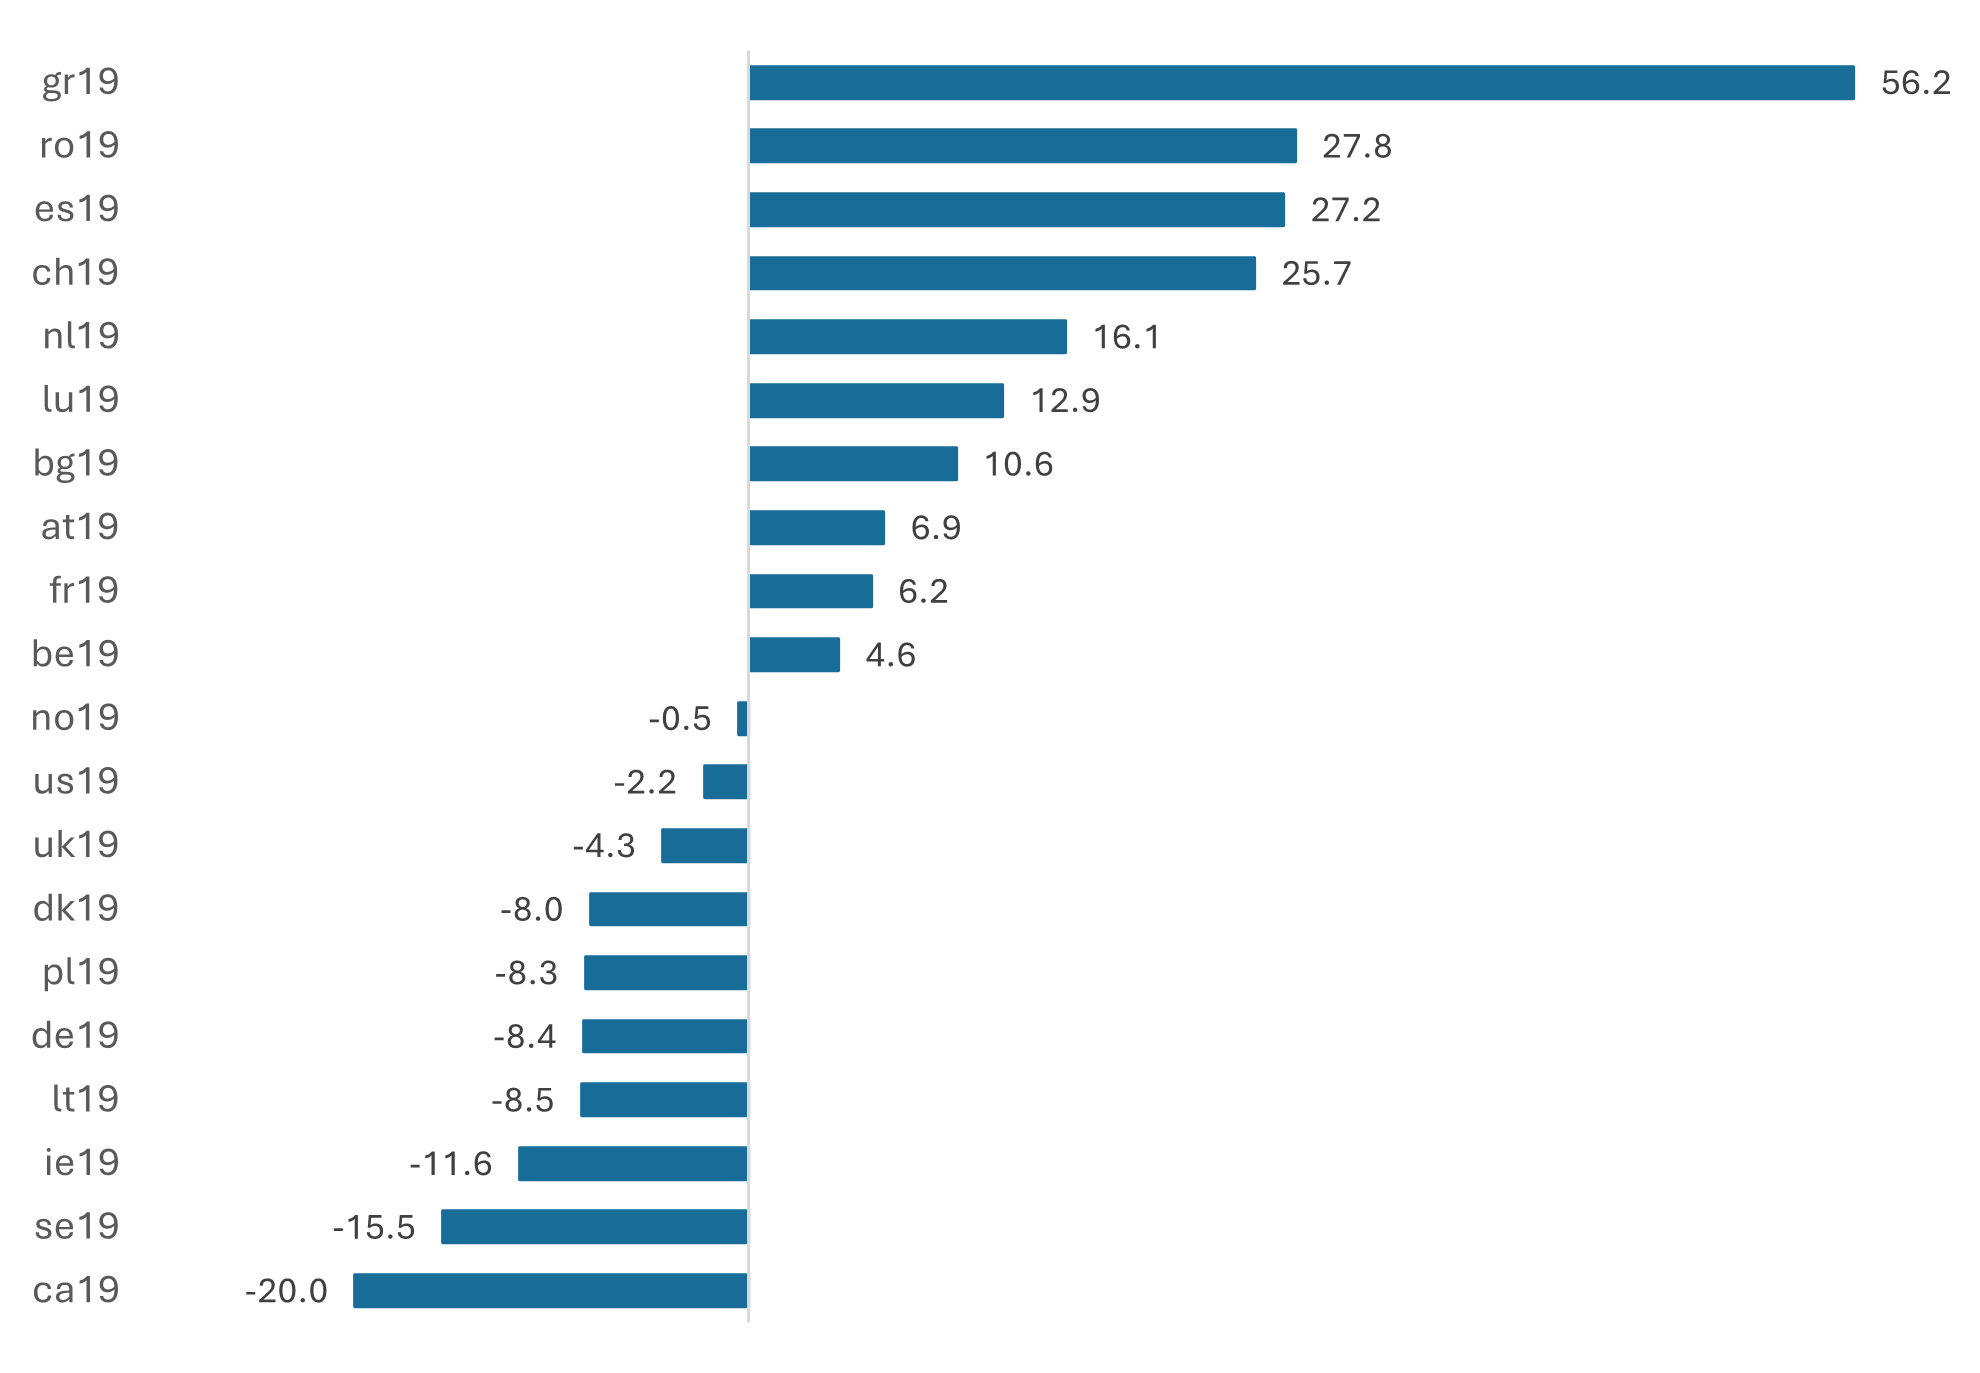
Note: The bars extend to the left of the zero line when poverty reduction favours households with children; the bars extend to the right when poverty reduction is greater for households without children.
Source: LIS Database
Discussion
For many valid reasons, poverty research has long focused on households with children. This may have inadvertently fostered the assumption that childless households are relatively less vulnerable to poverty. Our findings challenge this belief. In half of the twenty countries analysed, childless households are indeed more exposed to poverty than households with children. When it comes to deep poverty, childless households are especially likely to fall below the poverty line – in three countries out of four, the poverty rate of childless households is indeed higher than that of households with children.
The tax-transfer system plays a decisive role in determining these distinct poverty outcomes. In half of the countries in our sample, the tax-transfer system reduces poverty more among households with children than among childless households: when the reverse occurs, however, childless households appear to enjoy a comparatively larger advantage. On average, across our sample, childless households are relatively poorer than households with children even before redistribution in thirteen countries – a clear majority.
Within this broader comparative picture – in which childless households often face a higher poverty incidence – the United States stands out. Within our sample, it has the highest poverty rate among childless households. While households with children still show higher poverty under the standard 50% threshold, the deep poverty rate of childless households is relatively higher, a pattern shared with only three other countries in our sample – the United Kingdom, France, and Luxembourg.
Among childless households in the U.S., single women are particularly exposed to poverty; their poverty rate is more than three times that of single men and twice the mean for the childless group in general.
Again, the tax-transfer system is central to explaining these poverty outcomes. After Lithuania, the U.S. reduces poverty the least among childless households – only about a quarter of its pre-tax-pre-transfer poverty is reduced. Moreover, its tax-transfer system reduces poverty to a greater extent among households with children.
Pre-tax-pre-transfer poverty rates tell a different story: the U.S. is one of the seven countries within our sample, where poverty before redistribution is lower for childless households than those with children.
These findings underscore that childless households deserve as much attention in poverty research as households with children. This is especially important given that, at the policy level, many income support measures – including most of the programs that have expanded in recent decades – target primarily households with children. The United States illustrates this vividly: its welfare system is heavily shaped by conditionality and categorical eligibility, favouring households with children while leaving others with limited income support. In this context, the stark poverty differences between the U.S. and other countries highlighted earlier remind us that the generosity of anti-poverty policies matters, but so does their design – namely, how they target, and under what conditions.
In the forthcoming article, we plan to examine more closely the specific contribution of distinct income transfers to poverty reduction and investigate how variations in institutional setups shape poverty risks. While we will focus primarily on the U.S. case, such work would help clarify why similar levels of spending can yield different outcomes across countries and inform more effective policy design.
1 This note extends research presented in a 2024 paper commissioned by the Brookings Institution’s Hamilton Project (Gornick et al. 2024). A longer version of this note – coauthored by Mariani, Marx, and Gornick – is in progress.
2 This article is an outcome of a research visit carried out in the context of the (LIS)2ER initiative which received funding from the Luxembourg Ministry of Higher Education and Research.
3 We consider a household as relatively income poor if its equivalised income is below half of the country’s median equivalised household income.
4 Compositional differences – in particular, a greater share of extended households – might partly explain such a lower poverty rate before redistribution. We will further assess the prevalence of extended households and its consequences on poverty in the next phase of this project.
5 Taxes include income taxes and social contributions, while transfers include pensions, public social benefits, and private transfers.
References
| Alm, S., Nelson, K., & Nieuwenhuis, R. (2020). The diminishing power of one? Welfare state retrenchment and rising poverty of single-adult households in Sweden 1988–2011. European Sociological Review, 36(2), 198-217. |
| Brady, D., & Burroway, R. (2012). Targeting, universalism, and single-mother poverty: A multilevel analysis across 18 affluent democracies. Demography, 49(2), 719-746. |
| Brady, D., & Parolin, Z. (2020). The levels and trends in deep and extreme poverty in the United States, 1993–2016. Demography, 57(6), 2337-2360. |
| Cooper, K., & Stewart, K. (2021). Does household income affect children’s outcomes? A systematic review of the evidence. Child Indicators Research, 14(3), 981-1005. |
| Edmiston, D., Tucci, V., Aldama, I., Alcañiz Colomer, J., & Orujova, L. (2025) Singled Out: Household Types, Poverty Risk and Welfare Effectiveness Across Europe. Working Paper. UAB. |
| Ferragina, E., & Seeleib-Kaiser, M. (2015). Determinants of a silent (r) evolution: Understanding the expansion of family policy in rich OECD countries. Social Politics: International Studies in Gender, State & Society, 22(1), 1-37. |
| Frericks, P., & Gurín, M. (2023). Family as a redistributive principle of welfare states: An international comparison. Journal of European Social Policy, 33(1), 52-66. |
| Gornick, J. C., Brady, D., Marx, I., & Parolin, Z. (2024). Poverty and poverty reduction among non-elderly, nondisabled, childless adults in affluent countries: The United States in cross-national perspective. The Hamilton Project, Brookings Institution, Washington, DC. |
| Kreyenfeld, M., & Konietzka, D. (2017). Childlessness in Europe: Contexts, causes, and consequences. Springer Nature. |
| Maldonado, L. C., & Nieuwenhuis, R. (2015). Family policies and single parent poverty in 18 OECD countries, 1978–2008. Community, Work & Family, 18(4), 395-415. |
| Minujin, A., Delamonica, E., Davidziuk, A., & Gonzalez, E. D. (2006). The definition of child poverty: a discussion of concepts and measurements. Environment and urbanization, 18(2), 481-500. |
| Morgan, K. J. (2013). Path shifting of the welfare state: Electoral competition and the expansion of work-family policies in Western Europe. World politics, 65(1), 73-115. |
| Parolin, Z., & Brady, D. (2019). Extreme child poverty and the role of social policy in the United States. Journal of Poverty and Social Justice, 27(1), 3-22. |
| Parolin, Z., Desmond, M., & Wimer, C. (2023). Inequality below the poverty line since 1967: The role of the US welfare state. American Sociological Review, 88(5), 782-809. |
| Thévenon, O. (2011). Family policies in OECD countries: A comparative analysis. Population and development review, 37(1), 57-87. |
| Van Lancker, W., Ghysels, J., & Cantillon, B. (2015). The impact of child benefits on single mother poverty: Exploring the role of targeting in 15 European countries. International Journal of Social Welfare, 24(3), 210-222. |