![]()
Issue, No.34 (June 2025)
False Negatives?
Earnings Underreporting, Tax Overreporting in Surveys Worldwide*
Motivation
Incomes in household surveys are subject to various reporting and measurement issues biasing the static and dynamic assessments of inequality and poverty (Ceriani et al. 2022; Hlasny et al. 2022). Some households under/over-report their earnings or liabilities, fail to respond to questions about some sources of income, or are excluded entirely through their own choice or through decisions of statistical agencies or survey aggregators.
In contrast to tax registries, we may not expect income underreporting on household surveys, given that households have little to gain from lying or making themselves look poor in front of survey enumerators. Nevertheless, tallying all earnings and losses over the span of a survey period can be daunting, and reporting public assistance such as food stamps may be embarrassing, so some income sources of the rich and poor alike may be left out. Since truthful reporting on surveys cannot be ascertained or legally enforced, misreporting may be even more rampant in surveys than in tax records (Higgins et al. 2018).
That is not to say that surveys are inferior sources of information on the poor. The measurement problems have their analogies in tax registries, where taxpayers may intentionally conceal earnings, change the date of realization of certain gains or losses, choose which tax jurisdictions to report earnings under, or fail to file taxes altogether. In surveys and registries alike, the lower end of income distributions typically includes unsustainably low income values that fall short of deprivation thresholds according to any definition, such as the international $2.15/day extreme poverty line or the ‘wolf point’ necessary for bare survival (Davis 1941) or even zero. While households earning these incomes may still benefit from non-market production, non-monetary inflows and other remittances, these incomes are so low that they appear incompatible with sustainable consumption streams, and usually cannot be squared with the households’ observed behaviors and other socio-economic outcomes. Exactly-zero incomes are also quite unlikely in the population, as most households receive some monetary or non-monetary earnings, or private or public transfers. Zero incomes may be introduced by survey handlers, such as when not keeping a clear distinction in losses vs. missing information vs. non applicable information (Neugschwender 2020).
Existing evidence
Misreporting of earnings and tax liabilities, and shifting of their reporting across the years for strategic tax-liability considerations, are traditionally thought to be the primary sources of extreme income observations reported by households, particularly those at the lower end (Paulus 2015). Many of these households do not have a profile of deprived units (Brewer et al. 2017). Evidence from Latin America comparing the distribution of survey incomes and tax records shows that self-employment incomes are underreported even at the lowest survey quantiles. Beside the prime suspect of tax evasion, it may be that gains from self-employment may not have been captured in the survey snapshot – partly because of how survey questions are formulated, or because of accounting norms and practices. Households may have realized them outside of the snapshot window or in other legal jurisdictions. Finally, limited recall of gains from sales or of the annualized investment in self-employment activities may be responsible for accidental – yet still systematic and substantial – omission.
Evidence from linked survey and tax-registry data reveals that employment incomes at the bottom of the distribution may be particularly affected by discrepancies. In Estonia, they have led to underreporting of true earnings by 17% of the surveyed population (Paulus 2015). Linking survey and tax-records income data in the US also suggests substantial underreporting in surveys (Higgins et al. 2018). Linking income-survey and food-stamp administrative data shows that social assistance fails to be reported in surveys by over one-third of housing-assistance recipients, 40% of food-stamp recipients and 60% of general-assistance recipients, resulting in sharply underestimated bottom incomes (Meyer and Mittag 2019). Another problematic income source is imputed rent among houseowners: As evidenced in Peru, particularly the poorer among houseowners in rural areas tend to underestimate their rental values by 20–25% (Ceriani et al. 2019).
Experimental research design also reveals that individuals’ underreporting of earnings and over-deducting of liabilities is asymmetric between their positive and negative income flows (Fochmann and Wolf 2019). This, by extension, may call for separate assessments across those reporting lower earnings and liabilities, and those with higher ones.
Evidence from LIS database
Systematic study of rare extreme income values requires using large harmonized data where their ‘regularities’ can be inferred. The Luxembourg Income Study (LIS 2024) database, encompassing 900+ household surveys from 60+ countries, covering over 28 million households, facilitates such an analysis. The LIS database also covers most of the spectrum of national household surveys encountered around the world in terms of the level of economic development, inequality and poverty, sample size, and definitions of incomes. In light of this heterogeneity, the LIS database is an ideal testing ground for comparative income distribution analyses such as this one. The following analysis relies on 909 LIS surveys with harmonized income distributions. They span years 1963–2023, and cover countries on six continents, of all income and human-development classifications.
Among the 909 surveys, 810 surveys contain zeros or negatives for disposable household incomes: 638 surveys include zeros and 605 include negatives, with an overlap of 433 surveys containing both. Among the surveys containing some zeros or negatives, zero incomes typically make up 0.51% of overall samples (131,235 out of 25.9 million household records in the 810 surveys), and negative incomes make up 0.14% (36,806 records).
In 101 surveys, zeros and negatives account for over 1% of income records (or up to 9.2% in one survey). The values of negative incomes (evaluated in local currency units) are also not trivial in size. Mean negative income in a survey exceeds 200% of the mean overall nationwide income in 22 surveys. In another 76 surveys, mean negative income is as high as 100–200% of mean overall nationwide income. For illustration, the German 2019 survey contains 258 zeros and 16 negatives (together making up 1.4% of the sample of 19,963 households), where the negatives are on average three-quarters as high (in absolute value) as the survey’s positive incomes.
Zeros, as we have argued, are largely an artefact of the data preparation and cleaning practices by statistical agencies. Negatives, on the other hand, indicate a particular balance of households’ inflows and liabilities among the various income components. To understand the source of negative income values, we compare the role of several major income components. We highlight the share of households in survey samples that have negative capital income, negative self-employment income (henceforth ‘self-employment losses’), or tax and social security withholdings and adjustments higher than the always-positive income components (including wage earnings, transfers, pensions, and rental income; ‘excess tax outlays’ for short). We also calculate the means of the negative capital income, self-employment losses, and excessive tax outlays. These measures indicate how much the negative capital income, self-employment losses, or excess tax outlays contribute to the prevalence and magnitude of negative incomes in each survey (Hlasny 2023).
We find that the main source of negative incomes, in 60% of all surveys, is self-employment losses. Additionally, excess tax outlays are the main source of negatives in over one-third of surveys. In the remaining surveys, negative capital income accounts for the majority of negative disposable incomes.
The importance of self-employment incomes is not surprising. Self-employment, including farming, incomes are particularly prone to mismeasurement and misreporting given the irregular timing of gains and outlays. Self-employment losses are by far the most frequent source of negative disposable incomes, but their magnitude is not much higher than that of the excessive tax outlays and negative capital income when it comes to causing high sizes of negative incomes. In other words, compared to the excessive tax burden and negative capital incomes, self-employment losses are more frequent and more problematic at the extensive margin, but not necessarily the largest at the intensive margin. (For completeness, negative net transfers, after subtracting pensions, also contribute to negative incomes, but are much less prevalent and smaller in magnitude.)
For example, in the 2018–2022 United States, the few dozen households with negative incomes had outlays on income taxes typically 139–415% as high as the mean negative disposable income in those years ($107,000–159,000 compared to the negative incomes of $32,116–87,269 across the years). Brazil, Canada (especially older years) exhibit similarly high realized excess tax outlays. In France and Norway, meanwhile, negative incomes are largely due to negative capital incomes, while in Australia, Denmark, the Netherlands and the United Kingdom, for example, self-employment losses dominate in magnitude.
Richer and poorer countries exhibit diverging patterns. In low- and lower-middle income countries, self-employment losses are the most frequent as well as the largest source of negative disposable incomes in surveys (Figures 1 and 2). Higher up the distribution of country incomes, in upper-middle income and transitional economies, the sources of negative incomes vary, but self-employment losses and negative capital incomes dominate. Excessive tax assessments are also prevalent in their number if not in magnitude. Among high-income countries, self-employment losses still play a leading role in terms of their prevalence, but they join excessive tax assessments as the main drivers of the magnitude of negative incomes.
Figure 1. Negative self-employment incomes, negative capital incomes and excessive tax burden among non-zero incomes, by national income level (%)
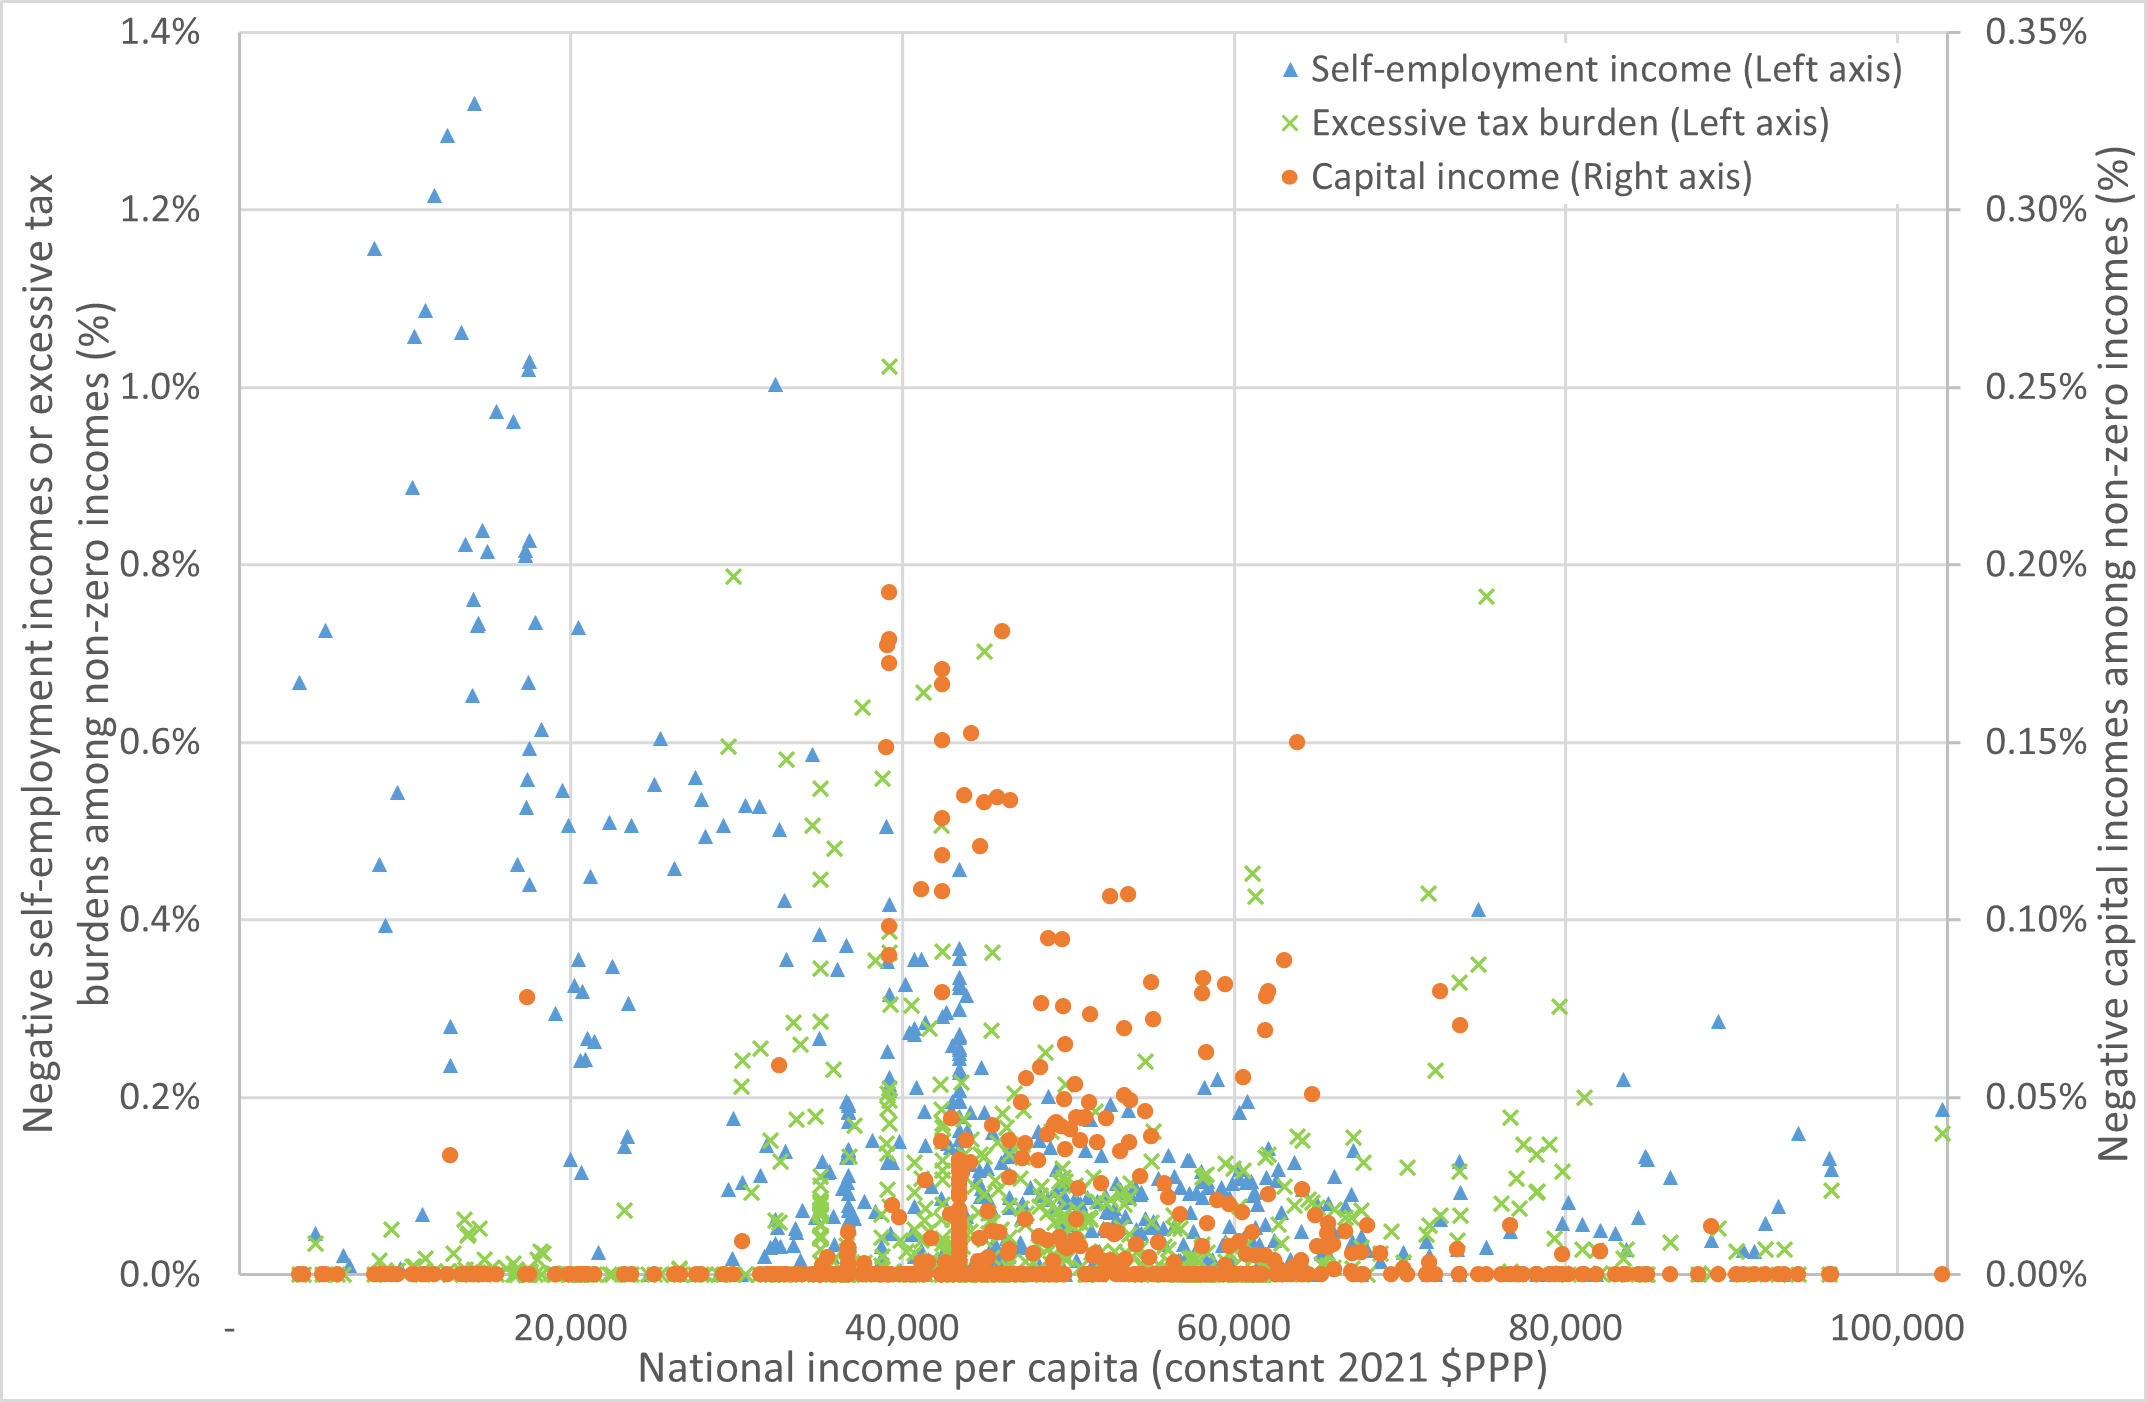
Note: Samples restricted to surveys with the income component non-missing. Sample shares with negative self-employment income or high tax burden shown on left axis; Sample shares with negative capital income shown on right axis. The figure is truncated from above for clarity of presentation. There are an additional 3 surveys with higher shares of negative self-employment income records as shares of mean income (9 and 4 surveys with higher mean negative capital incomes or excessive tax burdens, respectively).
Figure 2. Negative self-employment incomes, negative capital incomes and high tax burden as share of mean negative income, by national income level (%)
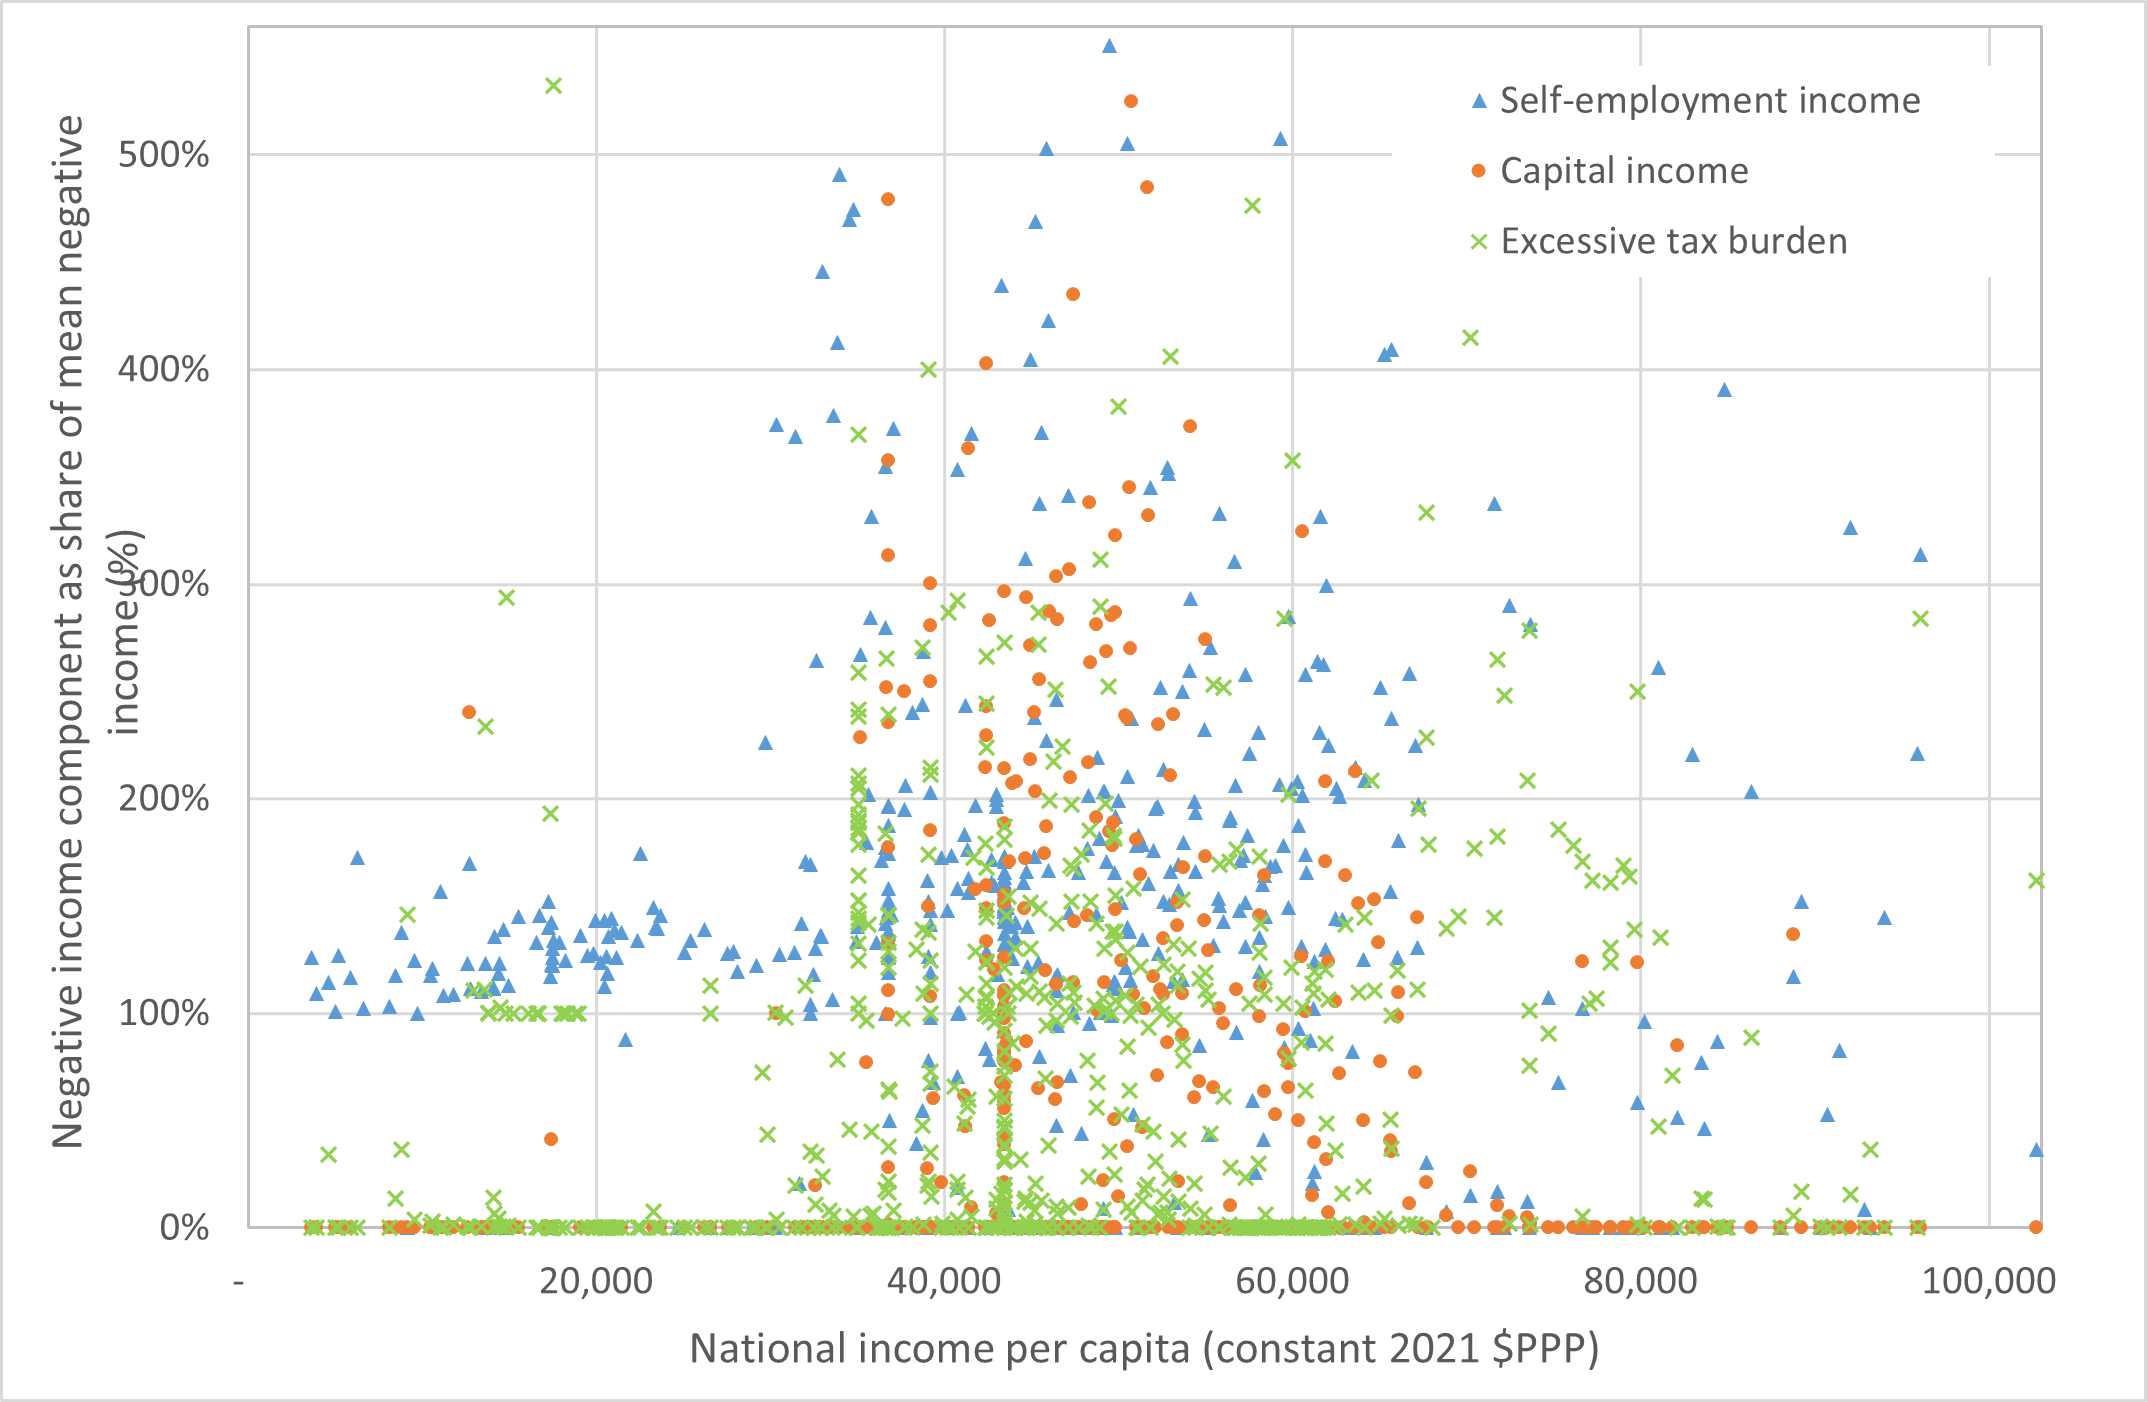
Note: Samples restricted to surveys with the income component non-missing. The figure is truncated from above for clarity of presentation. There are an additional 20 surveys with higher mean negative self-employment incomes as shares of mean negative incomes (2 and 9 surveys with higher mean negative capital incomes or excessive tax burdens as shares of mean negative incomes, respectively).
Are households with non-positive incomes poor or socially disadvantaged? Looking at some indicators of households’ contemporaneous and longer-term socio-economic position – including consumption, labor market status, health, education, marital status, homeownership and urban/rural residence – we conclude that households with negative incomes share similar characteristics with other households in terms of material wellbeing and social status. Table 1 confirms this for binary socio-economic indicators – the prevalence of desirable characteristics is as high among negative-income households as among positive-income households (or even higher). In fact, the lower the negative disposable income, the higher the share of households with better socio-economic status: This applies to household heads’ health, employment status, marital status and homeownership. By contrast, zero-income households appear to be presently materially deprived in terms of consumption, employment status and homeownership, even though their human capabilities as manifested by their health, education and residence near urban markets are not clearly worse than their peers’ (Table 1). Perhaps surprisingly, zero-income households are less likely to be engaged in farming, and less likely to reside in rural areas.
In LIS surveys where consumption is available, consumption of households with negative disposable income tends to be as high as consumption of their positive-income counterparts, or higher, while consumption of zero-income households is clearly lower. This is quite consistent across most surveys, and notably across all but a few survey rounds in Brazil, France, Georgia, Germany, Hungary, Italy, Mexico, Poland, Serbia and the United Kingdom.
Taken together, evidence in these paragraphs points to clear patterns in how non-positive incomes arise in surveys. At the same time, the evidence highlights that those incomes – both zeros and negatives – may not represent households’ true socio-economic standing or even contemporaneous material welfare. While the paradox could be partly attributed to households’ coping strategies such as consumption smoothing and engagement in non-monetary or non-market income supplementation when faced with crises, the bottom line is that the reported values underestimate households’ incomes and welfare. And, specifically, underreporting of self-employment earnings appears to play a predominant role in lower-income countries, joined by underreporting of capital earnings in middle income countries, while significant tax overreporting or overassessment contributes in high income countries.
Conclusions
Earnings underreporting and tax overreporting appear to plague national income surveys worldwide, and high-income countries are not spared. A substantial share of surveys as well as households responding to them show non-positive incomes, despite those households appearing to be otherwise socio-economically non-deprived. The negative incomes and their major components – self-employment losses, excessive tax liabilities and negative capital income – are often large in magnitude. Moreover, they are just the tip of the iceberg, since the presence of additional small positive incomes – or indeed misreported values at all income quantiles – may pose a still greater hurdle for understanding true inequality and poverty. The trouble is, the observed incomes are used by policymakers for setting poverty thresholds, identifying vulnerable populations, and producing accurate proxy means test indices for targeting the poor and tailoring public assistance. Proper measurement of bottom incomes and understanding their context is thus crucial in the drive to improve the living conditions of those truly at the bottom.
Table 1. Prevalence of selected socio-economic statuses by households’ disposable income
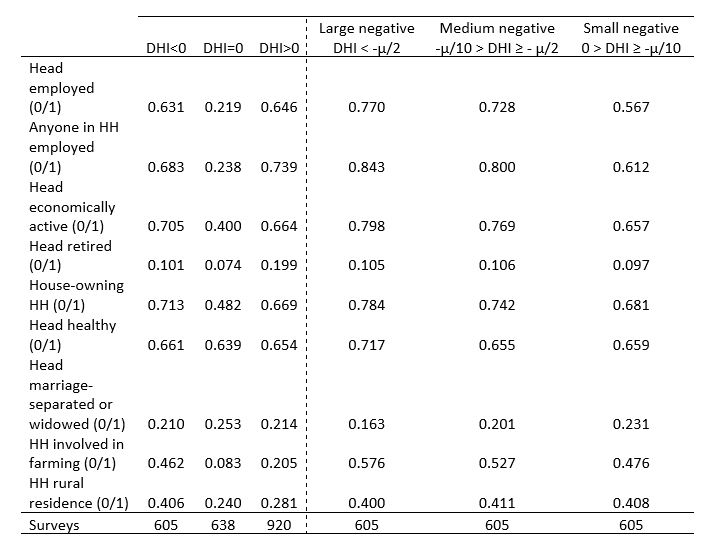
Notes: µ refers to mean national DHI. The reported values are the shares of households (population-weighted) with DHI in a particular range who hold a particular socio-economic status – out of all households in that DHI range.
* This article is an outcome of a research visit carried out in the context of the (LIS)2ER initiative which received funding from the Luxembourg Ministry of Higher Education and Research.
References
| Brewer, M., Etheridge, B., O’Dea, C. (2017). Why are households that report the lowest incomes so well-off?. Economic Journal, 127, F24-F49. https://doi.org/10.1111/ecoj.12334 |
| Ceriani C., Hlasny V., Verme P. (2022). Bottom incomes and the measurement of poverty: A brief assessment of the literature. Jacques Silber (Ed.) Research Handbook on Measuring Poverty and Deprivation. Elgar Handbooks in Development series. |
| Ceriani, L., Olivieri, S., Ranzani, M. (2019). Evaluating the accuracy of homeowner self-assessed rents in Peru. Policy Research Working Paper, 8983, Washington, DC: World Bank. |
| Davis H.T. (1941). The Theory of Econometrics. Bloomington, Principia Press. |
| Fochmann M., Wolf N. (2019). Framing and salience effects in tax evasion decisions: An experiment on underreporting and overdeducting, Journal of Economic Psychology, (72)260-277. |
| Higgins S., Lustig N., Vigorito A. (2018). The rich underreport their income: Assessing bias in inequality estimates and correction methods using linked survey and tax data, ECINEQ WP 2018-475, September. |
| Hlasny V. (2023). False negatives? Earnings underreporting, tax overreporting in surveys worldwide. Economic Research Forum (ERF) Working Paper 1694, December. |
| Hlasny V., Ceriani C., Verme P. (2022). Bottom incomes and the measurement of poverty and inequality. Review of Income and Wealth 68(4), 970-1006. |
| Luxembourg Income Study (LIS, 2024). Luxembourg Income Study Database, (multiple countries; 1963–2023). Luxembourg: LIS. |
| Meyer, B. D., & Mittag, N. (2019). Using linked survey and administrative data to better measure income: Implications for poverty, program effectiveness and holes in the safety net. American Economic Journal: Applied Economics, 11(2), 176-204. |
| Neugschwender, J. (2020). Top and bottom coding at LIS, LIS Technical Working Paper 9, September. |
| Paulus, A. (2015). Tax evasion and measurement error: an econometric analysis of survey data linked with tax records. Institute for Social & Economic Research Working Paper 2015-10, University of Essex, Colchester, UK: ISER. |