Issue, No.29 (March 2024)
Analyzing the Impact of Social Protection Programs in a Cross-national Perspective
This article is based on the authors presentation “How to compare social protection programs around the world and measure their role in eradicating extreme poverty and vulnerability to poverty” held at the UNECE Group of Experts on Measuring Poverty and Inequality meeting in Geneva, 28-29 November 2023.
1) Introduction
Eradicating extreme poverty constitutes a fundamental objective within the Sustainable Development Goals (SDGs) framework. The pivotal roles played by the State and non-governmental organizations (NGOs) in this pursuit are undisputed. Central to this endeavor are social protection programs, encompassing not only cash assistance but also the provision of essential goods and services through in-kind transfers. These programs offer a lifeline to impoverished families, augmenting their resilience and empowering them to enhance their overall well-being. While certain countries primarily channel their efforts toward supporting the elderly population, others adopt a more inclusive approach by identifying various vulnerable groups around which social programs and eligibility criteria are tailored. In this study, it is argued that examining long-term progress involves carefully analyzing both absolute and relative poverty. The cross-country dimension allows for gaining additional valuable information.
This cross-national study contributes to the discourse on poverty alleviation – the goal is to enhance the understanding of poverty dynamics and inform evidence-based policies for a more equitable and sustainable future.
Therefore, this study provides a structured approach to assess the impact of social programs. It is meant to build a framework to comprehensively evaluate the overall impact before and after allocating specific social programs across the entire society and among subgroups. Thus, the first section on methodological approaches builds the fundament for the following sections. As the overall study exceeds the format of Inequality Matters, it is divided into two separate articles. This first article will concentrate on relative at-risk-of-poverty thresholds, whereas the second part will elaborate specifically on absolute poverty methodology. Using the relative poverty methodology, this article showcases how far family benefits have effectively contributed to poverty prevention in society. A subsection exemplifies how the methodology can be adapted to a subgroup, namely single-parent families. The Luxembourg Income Study (LIS) Database, containing harmonized microdata files categorized by policy areas, serves as the data source. Spanning a period from the 1960s to the early 2020s, the LIS datasets provide a long-term perspective. Furthermore, using LIS data allows for simultaneously studying advanced and emerging economies. Last, a critical assessment of the methodology is provided. This article will conclude with a short interim summary, whereas the conclusive summary will be postponed to the second article.
2) Methodological key choices
As this study delves into poverty measurement, it is essential to clarify the various choices that shape our understanding of the term. This section outlines key decisions made in this exploration while focusing on describing alternative approaches.
Income definition and social benefits: This study focuses on the impact of social protection; thus, it is centering on income. Income here means more than just money—it includes goods and services from own consumption, non-cash employer benefits, and in-kind assistance from social programs. All the analyses use this comprehensive definition, depending on available data. It must be noted that pensions are excluded from the scope of social programs in this study for simplicity. Pensions are in many advanced countries the only source of income among the elderly, who by majority live in their own dwelling. Hence, measuring the impact of social transfers on the total society would by far be determined by the effect of pensions on the elderly. Equally, a split into contributory vs. non-contributory programs would bias this comparison towards high poverty prevention rates in countries where pensions are paid based on residency; however, many countries would achieve comparatively low poverty rates already through contributory pensions which combine elements of contributory and tax-financed systems. Many countries also pay minimum pension amounts through their contribution-based scheme. Therefore, it is more generally recommended to analyze the effect of pensions in a separate study focused on poverty prevention among the elderly.
Poverty measurement: Deciding how to measure poverty is crucial. This study compares the two most common ways in cross-national research: absolute and relative poverty thresholds. Absolute thresholds are used in studies trying to eradicate extreme poverty, often seen in emerging economies and the international framework by the World Bank (Jolliffe et al., 2022). In contrast, the relative methodology, prevalent in advanced economies, defines at-risk-of-poverty in relation to societal equivalised median income, typically referring to at-risk-of-poverty at the 60% threshold (e.g., Guio et al., 2021). This study will showcase both methodologies as the Luxembourg Income Study (LIS) Database comprises countries with varying development levels. Instead of the at-risk-of-poverty at the 60% threshold, the threshold will be set at 50 %.
Accounting for household size: The common choices for accounting for household structure include per capita adjustment, square root scale, or the OECD modified scale, which considers different weights for individuals below and above 15 years. Recognizing that resources are shared among household members, also this study adjusts for economies of scale. In this study, the square root scale is applied in the sections on relative at-risk-of-poverty, aligning with the standard methodology at LIS. The findings in the sections on absolute poverty measurement are illustrated using the per capita adjustment, as it is the standard approach in the World Bank methodology.
Grouping social benefits: Social benefits are grouped into policy areas in the LIS Database, a limitation acknowledged in this study. While individual programs may be more politically relevant in a national context, the collective impact of social programs is crucial. Still, this study showcases that the joint payment of cumulative benefits is integral to protecting the vulnerable effectively.
Population group selection: Another important aspect is choosing which group of people to focus on. Social benefits are designed for specific population sub-groups. Thus, the study looks at whether these benefits reach the intended group or if they remain poor even after receiving social transfers. The initial stage assesses the overall impact before and after the distribution of benefits through the various policy areas throughout society. The subsequent stage focuses on a high-risk group—single-parent households—to reveal the effects of social programs on this vulnerable group. Alternative population sub-groups could be easily motivated.
3) Relative at-risk-of-poverty rates – the cross-national focus
Let us first look at relative at-risk-of-poverty measures. Figure 1 illustrates three relative at-risk-of-poverty rates: (1) living with less than 50% of median equivalised income vs. (2) rate without family transfers vs. (3) rate without all public transfers (excluding pensions). The grey bar (measure 1) refers to the at-risk-of-poverty rate after all social transfers; the threshold is defined as living with income below 50 % of the median equivalised disposable household income (dhi). Four example countries are chosen to showcase the international comparison. Visually, it is clear that Belgium, Sweden, and the United Kingdom yield at-risk-of-poverty rates of around 10 %. In contrast, the bars in the United States are between 50 % and twice as high, depending on the year one analyses.
Interestingly, taking out social programs from this calculation (at a fixed threshold of at-risk-of-poverty calculated on dhi) yields different patterns. First, let us be clear, this is simply a technical exercise. Removing social benefits from one day to another would cause the household’s behavioral responses to prevent falling into poverty. Thus, the rate without family transfers (measure 2) and the rate without all public transfers, excluding pensions (measure 3), should not be considered as observed at-risk-of-poverty rates. The two rates simply describe in a static framework how much at-risk-of-poverty is reduced at a specific point in time (reference period) through the payment of social transfers: 1) the distance from the blue square to the grey bar mirrors the percentage reduction through all social transfers excluding pensions, and 2) the distance from the red square the grey bar mirrors solely the impact of paying family benefits. Thus, the closer the red square is to the blue one, this illustrates that the additional payment of family benefits achieves the bulk of at-risk-of-poverty prevention.
Fig. 1. Relative at-risk-of-poverty rates before and after social transfers
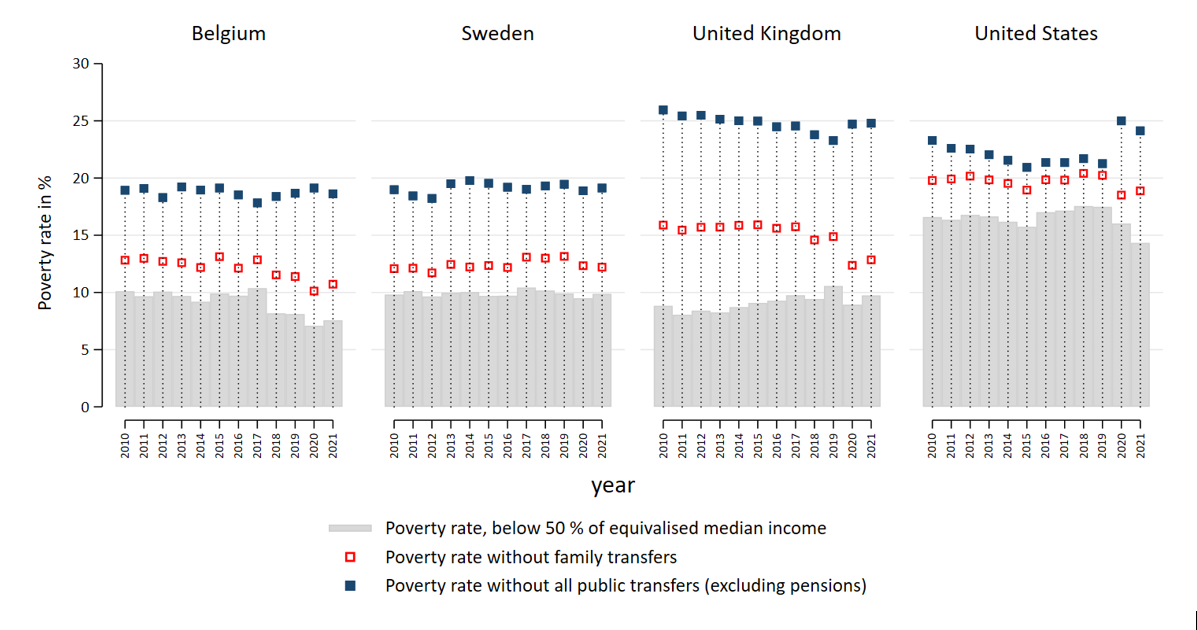
The U.S. reader might be immensely alerted – family benefits in the U.S.? It needs to be noted that in the LIS Database, tax credits such as the Child Tax Credit (CTC), the Additional Child Tax Credit (ACTC), the Earned Income Tax Credit (EITC), and State tax credits are considered family benefits. Thus, two points can be concluded for the United States. First, receiving this package of tax credits and family assistance transfers is a significant component in reducing at-risk-of-poverty, e.g., in 2019, where a) the before social transfers rate stood at ca. 21.5 %, b) the payment of all social transfers, except family benefits decreased at-risk-of-poverty to ca. 20 % and c) the further payment of family benefits decreased at-risk-of-poverty from 20 to 17.5 %. The second point becomes evident from the cross-national comparison. 17.5 % is still comparatively high for an advanced economy, and in the other three countries, the social security system shows a much more substantial poverty prevention impact of social programs, in the U.K. in particular. Although, in these three countries, other social programs are much more relevant for at-risk-of-poverty reduction – the additional payment of family benefits is only one component among others. It is worth noting that all three countries show that in the time of the COVID crisis in 2020 and 2021, other social programs have created an increased at-risk-of-poverty reduction. Hence, the additional family transfers become less critical for the reduction but remain relevant.
There are various caveats to acknowledge. I will focus on two main points: 1) the methodology of relative at-risk-of-poverty and 2) the limitations of an aggregated perspective.
First, related to the methodology, since the measure is relative to the societal mean, it is also always connected to the economic cycle. Thus, e.g., the higher the wages and disposable income increase, the higher the threshold for at-risk-of-poverty. Income increases at the lower end of the income distribution that are lower than the average increase may lead to a higher proportion of persons below the threshold. At the same time, this increase cannot be interpreted as a percentage increase of individuals in hardship; the measure simply refers to well-being compared to the median. Even the lower increases at the bottom during an economic boom refer to progress in well-being. The increase in at-risk-of-poverty is counterintuitive to this. However, it should be noted that in cross-national comparisons, relative at-risk-of-poverty rates have one striking advantage: they are internationally comparable. In contrast, alternative national absolute poverty lines might better capture progress, but they may lack international comparability.
Second, the aggregated perspective has its limitations. A more general point relates to a clear understanding of who is lifted out of at-risk-of-poverty and who remains even poor after receiving one or more transfers. Thus, the curious analyst might want to study concurrent payments and social profiles simultaneously. How do certain benefits protect certain risk groups? What are the social characteristics of the ones who are not protected? Are they not eligible for any social benefits? Also, some benefit packages might work well, as they have been designed to be paid cumulatively, whereas others might be limited as they do not allow concurrent recipiency. These policy needs shift the requirements for an informative visualization tool from a broad country comparison toward a dashboard of a two-country comparison, containing the joint study of various elements at the same time, e.g., recipiency patterns of benefits for sub-population groups and possibly by other socio-demographic criteria such as age, labor force status, and immigration background. There is a wide variety of selection parameters to incorporate for a powerful and informative comparison tool if one wants to zoom in to understand what social program packages work best and why.
4) Relative at-risk-of-poverty rates – single parents in Poland
Figure 2 illustrates the additional value of analyzing social transfers in a subpopulation setting. This is shown by restricting the sample to single-parent households. Single parents are defined here as one parent living only with their own or adopted non-adult children (below 18 years of age) without other adults in the household; these persons may or may not have partners in other households (typically not distinguishable in the source data). The case of Poland was chosen due to a rather substantial change in family policy implemented in 2016; the new program Family 500+ introduced transformed assistance-based benefits into universal child benefits (Paradowski et al., 2020).
First, how to read the data. The grey bar in this figure now refers to the at-risk-of-poverty rate among single-parent households, where each member is considered at-risk-of-poverty when their equivalised income is below the societal median. A black cross has been added which refers to the at-risk-of-poverty rate among the entire society. The partial effect of family transfers is shown on the left-hand side and the one of general assistance on the right-hand side.
Fig. 2. Single-parent households: an illustration of Poland
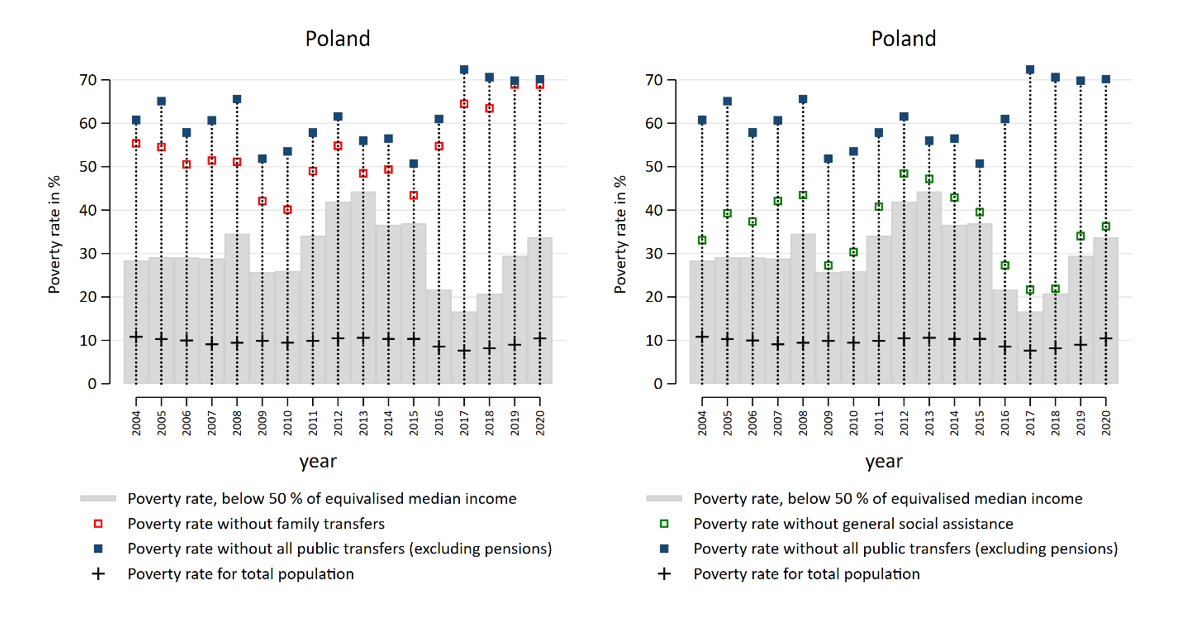
Figure 2 supports that the defined risk group of Polish single parents has a substantially higher at-risk-of-poverty rate. Not surprisingly, family benefits are a significant element in the reduction of at-risk-of-poverty among single parents. However, in addition, social assistance benefits play a role to some extent. Figure 2 mirrors the effect of the new universal program Family 500+ in reducing the risk of poverty among single parents for the following years. At the same time, single parents more and more depend on the existence of the program, as removing family benefits from disposable income would lead to at-risk-of-poverty rates beyond 70 % since 2017. This indicates that single parents achieve now less poverty prevention through market income before social transfers than before the reform. Again, it would be very relevant to understand better the social background of the single parents who receive those family benefits. Have they reduced their inclusion in the labor market? What are the socio-demographic characteristics of the ones who remained poor after receiving the benefits? Could there still be an argument to complement family assistance with further means-tested social assistance?
5) Interim conclusion
To conclude this first part on relative measures, I want to stress the variety of valuable analyses that can be carried out with the currently available quantity of microdata across countries. Relative at-risk-of-poverty rates do not measure poverty directly, however, the numbers can raise concerns about action, as they indicate that specific risk profiles fall short when compared to the median standard in a country. When we compare relative at-risk-of-poverty over time, we get a better idea of how things have changed for vulnerable groups and how policies have made a difference. The time and cross-country dimensions also give valuable information about policy intervention and the behavioral consequences of persons adapting to these changes in the short- and mid-term. A powerful visualization tool with several clear options to explore the data seems a valuable addition in this regard.
With this interim conclusion, motivation is made that not only one indicator should be examined to analyze well-being. Notably, the effectiveness of social transfers in eradicating absolute poverty should be studied in parallel. Thus, a second article (to be released in June 2024 in Inequality Matters) will discuss the potential contributions and drawbacks of analyzing poverty with a methodology of absolute poverty lines.
References
| Paradowski, P.; Wolszczak-Derlacz, J.; Sierminska, E. (2020). Inequality, Poverty and Child Benefits: Evidence from a Natural Experiment, LIS Working Paper Series, No. 799, LIS Cross-National Data Center in Luxembourg. |
| Guio, A.-C.; Marlier; E., Nolan, B. (2021). Improving the understanding of poverty and social exclusion in Europe, Luxembourg: Publications Office of the European Union. |
| Jolliffe, D.; Gerszon Mahler, D.; Lakner, C.; Atamanov, A, Kofi Tetteh-Baah, S. (2022). Assessing the Impact of the 2017 PPPs on the International Poverty Line and Global Poverty. Policy Research Working Paper 9941, The World Bank. |