
Issue, No.28 (December 2023)
Missing Wealth Distribution, Wealth Inequality and Anti-Inequality Policies*
1 Introduction
In decades marked by increasing wealth-to-income ratios and disparities (Piketty & Zucman, 2014), the design of wealth taxes is a pertinent topic in economic discourse (Saez & Zucman, 2022). While only a few countries implement comprehensive wealth taxes, others primarily rely on property taxes and inheritance (or transfer) taxes for wealth transmission across generations. Despite their generally progressive nature, existing wealth taxes exhibit limited redistributive impact due to their small scale (Kuypers et al., 2020). Given the underperformance of current legislation, there is a growing need to study the development of effective wealth taxation strategies to address wealth inequality significantly. However, assessing the role and efficacy of wealth taxes, even in terms of policy design, hinges on the availability of reliable data. Sampling errors, particularly related to missing data, are widely discussed in the literature on wealth and income distribution. Various methodologies, such as replacement (Vermeulen, 2018) and re-weighting (Munoz & Morelli, 2021), address unit non-response issues, especially at the top income levels. Recent efforts linked to the World Inequality Database (WID) aim to integrate data from tax sources, household surveys, and National Accounts to create Distributional National Accounts (DINA), allocating national income to households. Carranza et al. (2023) apply the WID adjustment to examine inequality variations across countries using EU-SILC data. Much of the literature focuses on household income and its inequality, given the generally lower quality of wealth data, particularly from surveys. In the case of wealth distribution, sampling errors due to item non-response, along with non-sampling errors like under-reporting, pose challenges to data accuracy.
Hence, the main goal of the work is to match the literature on the adjustment of wealth distribution with that on the effects of wealth taxation. We study the missing part of the wealth distribution, explicitly focusing on financial assets, in the Luxembourg Wealth Study (LWS) and then explain a methodology to correct the under-reporting of financial assets in surveys. We apply this procedure to Austria, Canada, and Italy and, finally, provide initial evaluations on the policy relevance of the missing part of the wealth distribution.
2 Micro-macro wealth data discrepancies in LWS
In this section, we compare the wealth figures of LWS countries with their National Accounts counterpart. Such a comparison is standard in the literature, both institutional and academic; peculiar examples are the ECB paper by Ahnert et al. (2020), focusing on Household Finance and Consumption Survey (HFCS), and the paper by Jäntti et al. (2008), who adopt the initial waves of LWS. All the authors agree on the complexity of these micro-macro comparisons due to conceptual differences between micro (surveys) and macro (NA) data, for instance, related to the definitions of the household, the reference periods, or the different valuations of assets, debt, and incomes (self-evaluation in surveys, market prices in National Accounts).
Conscious of the possible difficulties and with some assumptions explained below, we conduct a preliminary analysis of the micro-macro wealth comparison in LWS. We provide figures for eight countries selected according to the degree of comparability and availability of official sources: Austria, Canada, Finland, Germany, Italy, Norway, the United Kingdom, and the United States.
Regarding the National Accounts, we use single-country data sources provided by national statistics institutes.1 In particular, we focus on the National Accounts of the household sector. In implementing the comparison, we modulated the definitions of wealth components adopted in LWS and NA to be as coherent as possible, considering significant differences across countries. The main issue related to the micro-macro comparison, well explained in Ahnert et al. (2020), regards the role and categorization of business equity. In the financial accounts, there is no similar concept; therefore, the value (available in surveys) may end up accounted for as financial or non-financial assets.
We concentrate on financial assets and real estate wealth as primary reference aggregates. The latter is defined as the sum of four main components: i) deposits and currency; ii) bonds and other debt securities; iii) stocks and other equities plus investment funds and alternative investments; and iv) other non-pension financial assets (residual). To reduce the bias between surveys and NA, we do not consider pension entitlements and reserve guarantees as part of the financial assets. Real estate assets are constituted by the value of all the real estate owned, both residential and not, including the value of built-up land.2
The selected countries present some significant differences in terms of data structure. Norway is the only country with census-like register data (they provide LWS with a 10% extraction from administrative registers). Finland combines survey and register data; the remaining countries have survey data.3 Other crucial differences across these countries’ wealth data consist of the data collection at the household or individual level and the possible over-sampling at the top for correcting the non-response to the survey. Out of the eight countries, only in the United Kingdom and Norway are the wealth figures recorded at the individual level; in the other countries, wealth is collected at the household-level. Oversampling at the top was conducted in Canada, Finland, the United Kingdom, and the United States.4
In Figure 1, we present ratios between LWS weighted totals and National Accounts totals in terms of financial assets and real estate wealth. The primary evidence is that financial assets have a ratio consistently lower than real estate wealth for all the countries and all the waves. In Italy, as well-known in research from the Bank of Italy (Bonci et al., 2005; D’Alessio & Neri, 2015), the issue of under-reporting in financial assets is particularly pronounced (only around 20% of the national account totals is captured by the survey). Analogous (low) figures are found in Austria, Canada, and Germany (top row in the graph). By contrast, real estate wealth always has the highest ratios, meaning real estate is captured more adequately than financial assets.
In the bottom row, we group countries that present peculiarities with respect to the rest. While Finland may be considered a bridge between the two groups because the register wealth information is incorporated into the survey structure, in Norway, the ratios show the impact of complete register data on data reporting. Specifically, in Finland, the ratio for financial assets was around 50% in the last wave (2016), and in Norway, this value reached 97% in 2021. In Norway, there is also a significant mismatch between micro and macro data on real estate. The explanation is due to inconsistencies between register and National Accounts computations of real estate values, with more detail available in Epland and Kirkeberg (2012).5
For the United Kingdom, the ratios for financial assets are around 60%, well short of the NA aggregates but still much higher than for other survey-based countries. Considering that the oversampling already seeks to address possible non-responses at the top, this could mean that the under-reporting issue is less relevant in the UK.
Figure 1: Comparison between LWS weighted totals and National Accounts totals, ratios
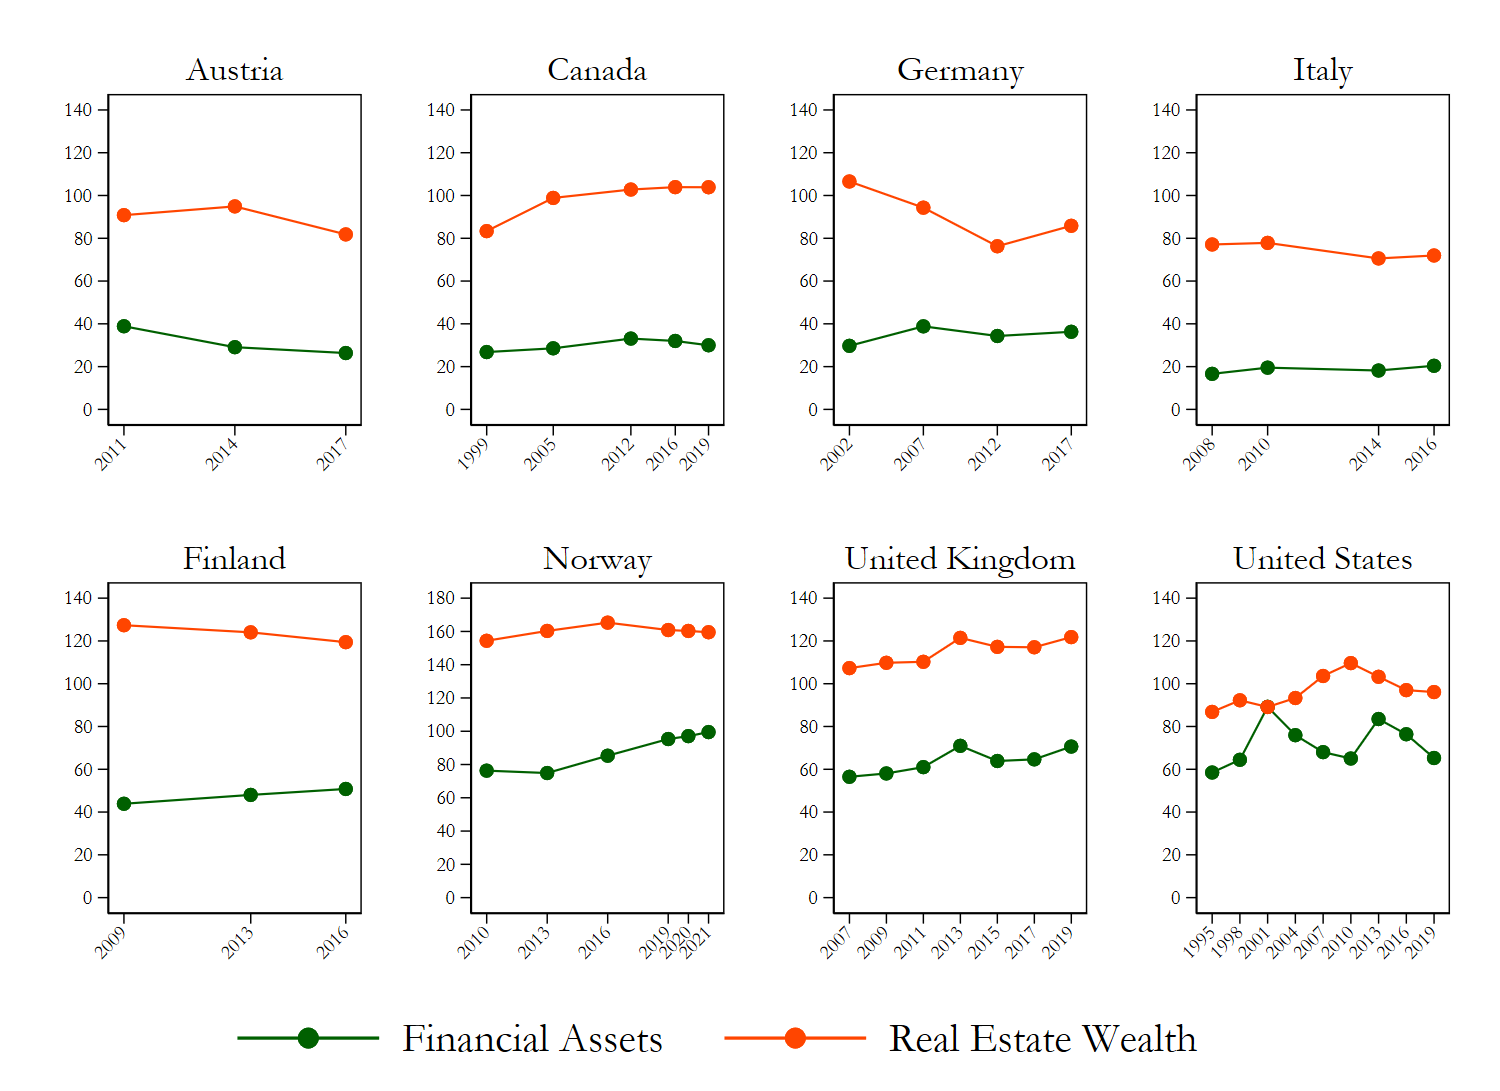
Note: 100 = perfect equality between LWS and NA.
Source: Authors’ elaborations based on Luxembourg Wealth Study (LWS) Database and National Accounts.
Moreover, an additional and potentially important role may be played by the different survey designs since the data are collected at the individual rather than household level.
Finally, in the United States, the ratio of financial assets is slightly higher than in the UK. An explanation for this could be the over-sampling conducted to adjust the baseline sample, although, overall, the low under-reporting is remarkable compared to the other countries.
The weight of business equity, which is the possible driver of much of these discrepancies, changes across countries: in Italy (2016), it constitutes 9% of the total wealth (sum of financial assets and real estate wealth), while in the US it rises to the 26% in 2019. The register data display a very low incidence of business equity, around 5% in Finland and around 1% in Norway. Although the role of this wealth component will deserve much attention in the future developments of this work, their weight, especially in some countries, is low, and even if they were all attributed to financial assets, this would not imply the solution of the under-reporting puzzle.
Given the evidence shown in Figure 1 and discussed in this section, we decided to focus on three of the eight countries to implement the correction for the under-representation of financial assets. These countries, Austria, Canada, and Italy, are those where the ratios are the lowest. Germany was discarded since the information in the detailed composition of the financial assets is missing.
3 Methodology, correction and preliminary results
In this section, we build on the results of the previous section to implement a methodology to correct the missing financial wealth distribution. The approach is inspired by a procedure applied by Conti et al. (2023) to Italian wealth data (SHIW). In that paper, which focuses on presenting a dynamic micro-simulation model for the Italian economy, a correction to financial wealth ownership and amounts in the baseline distribution is carried out, and the corrected distribution is subsequently inserted into the micro-simulation model. Here, we also separate the correction procedure into ownership and amounts. The correction for ownership follows the one adopted by Brandolini et al. (2009) on Italian data. We run a multinomial model (pooled over all available waves) to determine the probability of owning a more or less sophisticated investment portfolio. Next, we estimate single logistic models to analyze the impact of socioeconomic and financial variables on the probability of owning each specific asset (bonds, stocks, or investment funds). A threshold in the probability equal to the mean plus one standard deviation from the mean is then set. Households with a probability higher than the threshold are attributed the ownership. Finally, values of financial wealth (for each financial asset) to households who are “new” owners are imputed through matching (using Mahalanobis distance metrics)
The amount correction was applied with statistical matching using the Norwegian database as the donor and datasets from Austria, Canada, and Italy as recipients. The Norwegian data source of financial assets is the most reliable among the analyzed countries, given their different nature (register data). To control for systematic differences between the donor and recipient samples and obtain a more accurate matching, we divided the dataset into 30 cells based on financial asset percentiles. We proceed to match units that are included in the same cell only. The matching algorithm uses standard information between the two datasets to match the units in the donor and recipient datasets (subject to the cell constraint).
Overall, the rationale of this methodology is to provide an increase in the LWS/NA financial wealth ratio guided by reasonable economic criteria, given the survey structure. The methodology is conceptually separated from other methods, such as the Distributional National Accounts (DINA) approach, in which the entire household wealth is assigned to individuals.
In Table 1, we present preliminary results from our elaborations on data from Austria, Canada, and Italy for the last available wave in each of the three countries.6 The complex procedure explained above increases financial assets’ LWS/NA ratios, which are more pronounced in Canada and Italy than in Austria. The rise in the overall amount of financial assets is reflected in measured wealth inequality in both financial assets and net wealth. In Austria, the change in the Gini index of net wealth is less pronounced than in Canada and Italy. Finally, we undertake a simple exercise to evaluate the extent of the distributional effect of a simplified wealth tax. The tax structure is relatively straightforward; we let households beyond 1 million dollars pay a flat 5% tax on their net wealth. The conclusion is that the impact of the tax in reducing wealth inequality is lower with the original wealth distribution than with the corrected distribution. This effect is less substantial in Austria due to the reduced size of the correction and the overall greater equality of the original distribution compared with Italy and Canada. We expect these discrepancies to be broader when considering more progressive taxes.
Table 1: Wealth totals and inequality with original and corrected financial assets
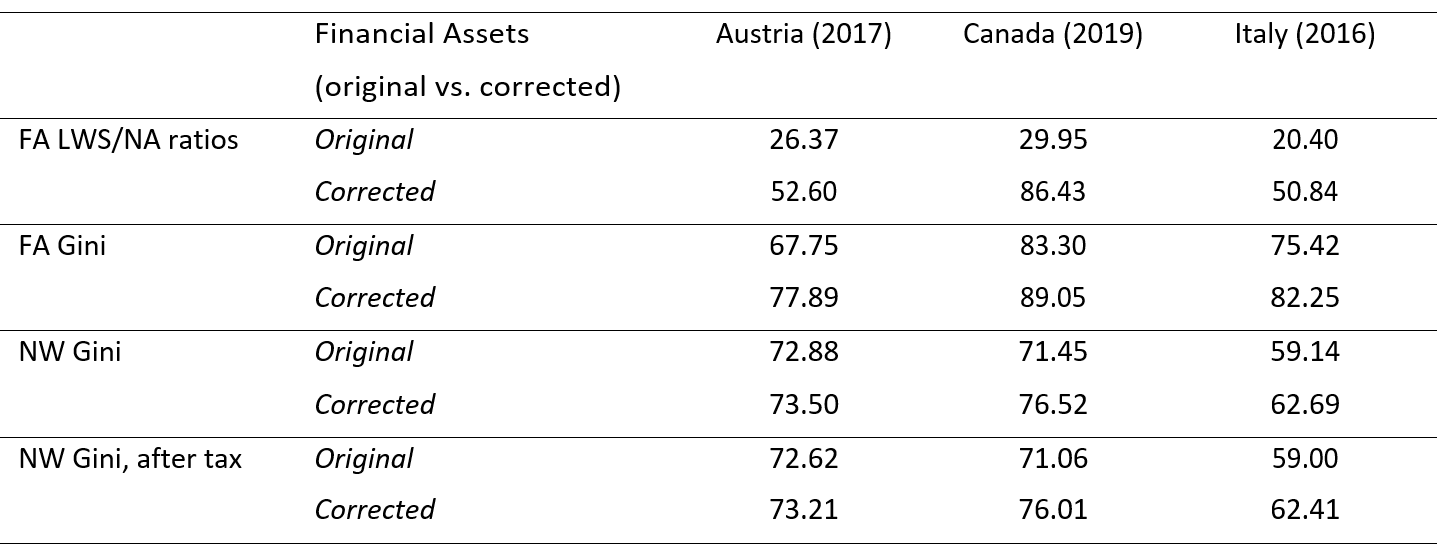
Note: FA: Financial assets; NW: net wealth. Original refers to the wealth distribution available in LWS (Austria, 2017; Canada, 2019; Italy, 2016). Corrected refers to the wealth distribution after the application of the correction methodology on financial assets.
Source: authors’ elaborations on Luxembourg Wealth Study (LWS) Database.
The next stages of the research will involve expanding the analysis to other countries in the LWS database, improving the validation of the correction procedure, and studying the distributional effect of specific taxes on financial assets compared with non-financial assets.
* This article is an outcome of a research visit carried out in the context of the (LIS)2ER initiative which received funding from the Luxembourg Ministry of Higher Education and Research.
1 The OECD provides Financial Assets Accounts who accommodate international comparison, however, they not include figures on non-financial assets (OECD, 2017).
2 In the United States we consider only the principal residence.
3 Austria: HFCS; Canada: SFS; Germany SOEP; Italy: SHIW; United Kingdom: WAS; United States: SCF.
4 In the United States six observations had net wealth at least equal to the minimum level needed to qualify for the Forbes list, thus they were removed from public data set.
5 In Table 6, pp. 15 the ratio between survey and National Accounts for dwellings is equal to 151.
6 Please contact the authors before quoting.
References
| Ahnert, H., I. K. Kavonius, J. Honkkila, P. Sola (2020). Understanding household wealth: linking macro and micro data to produce distributional financial accounts. Technical report, European Central Bank. |
| Bonci, R., G. Marchese, and A. Neri (2005). La ricchezza fin anziaria nei conti finanziari e nell’indagine sui bilanci delle famiglie italiane. Bank of Italy Temi di Discussione (TD) No. 565. |
| Brandolini, M., E. Giarda, M. Moriconi, and M. Loi (2009). Possibili effetti dell’under-reporting sull’analisi della ricchezza finanziaria basata sull’indagine dei bilanci delle famiglie di Banca d’Italia. Prometeia Rapporto di Previsione Ch. 8, 123-131. |
| Carranza, R., M. Morgan, and B. Nolan (2023). Top income adjustments and inequality: An investigation of the EU-SILC. Review of Income and Wealth 69 (3), 725–754. |
| Conti, R., M. Bavaro, S. Boscolo, E. Fabrizi, C. Puccioni, and S. Tedeschi (2023). The Italian Treasury Dynamic Microsimulation Model (T-DYMM): Data, structure and validation. International Journal of Microsimulation: forthcoming. |
| D’Alessio, G. and A. Neri (2015). Income and wealth sample estimates consistent with macro aggregates: some experiments. Bank of Italy Occasional Paper (272). |
| Epland, J. and M. I. Kirkeberg (2012). Wealth distribution in Norway. Evidence from a new register-based data source. Oslo, Norway: Statistics Norway. |
| Jäntti, M., E. Sierminska, and T. Smeeding (2008). The joint distribution of household income and wealth: Evidence from the Luxembourg Wealth Study. |
| Kuypers, S., F. Figari, and G. Verbist (2020). An assessment of wealth taxes in a joint income-wealth perspective. Technical report, EUROMOD Working Paper. |
| Munoz, E. and S. Morelli (2021). kmr: A command to correct survey weights for unit nonresponse using groups’ response rates. The Stata Journal 21 (1), 206–219. |
| OECD (2017). Understanding Financial Accounts. OECD Publishing, Paris, https://doi.org/10.1787/9789264281288-en. |
| Piketty, T. and G. Zucman (2014). Capital is Back: Wealth-Income Ratios in Rich Countries 1700–2010. The Quarterly Journal of Economics 129 (3), 1255–1310. |
| Saez, E. and G. Zucman (2022). Wealth taxation: lessons from history and recent developments. In AEA Papers and Proceedings, Volume 112, pp. 58–62. American Economic Association 2014 Broadway, Suite 305, Nashville, TN 37203. |
| Vermeulen, P. (2018). How fat is the top tail of the wealth distribution? Review of Income and Wealth 64 (2), 357–387. |