Issue, No.20 (December 2021)
Inequality Reduction over the last two Decades: Observations from the Newest LIS Data
While economic inequalities between countries have generally seen a decline over the past two decades, primarily due to the rise of China and India, there has been increasing concern about growing inequalities within developed countries over the same period. This scrutiny has been especially noticeable since the financial crisis of 2008, seen by many as the manifestation of the underlying ills of the same system that has led to said worrying trends. Even though some degree of income inequality is generally considered justified or even desirable, there are particularly important trepidations about the effects severe income inequality might have on economic growth as well as socio-political stability (primarily through the incitement of populist movements), not to mention the likely implications on the relative living standard of the most vulnerable members of society.
In this brief, we inspect the changes in the income distribution of several high- and middle-income countries over the first two decades of this century. More specifically, we take a closer look at a selection of the data newly made available in the Luxembourg Income Study (LIS) Database as part of the December 2021 LIS data release which, in total, is comprised of 61 entirely new and 45 revised data sets covering seven different countries.
The analysis provided builds on parts of the article of Munzi and Neugschwender (2021a) in the March 2021 issue of Inequality Matters and is structured as follows. In a first step, this article presents an overview of several Gini Index trends based on two different definitions: gross income and disposable income. This enables an overview of how much taxation and social contribution payment has reduced inequality and how this pattern differs both by country and/or time. In the second section, we consider how incomes have changed at the bottom, the middle, and the top of the distribution, respectively. Doing so makes it possible to distinguish the parts of the population that have benefitted the most from economic growth over the last two decades. Such considerations have recently been among the most important and contentious in globalization-critical discourse and thus merit special attention.
It is essential to emphasize the specific conception of ‘inequality’ employed in this article and its limitations. This article focuses purely on inequality of income. This particular definition is certainly of heightened relevance to the redistributive efforts of modern welfare states, but various other considerations would have to be included for a more holistic comparison of human well-being across countries and time. For instance, Munzi and Neugschwender (2021a) mention “wealth, material well-being, or social exclusion” as other relevant factors.
We consider the changes in the Gini Indices for three countries for which LIS provides data on both gross and disposable (net) household income: Austria, Australia, and Colombia (Figure 1). Gross income refers to labour and capital income, contributory pensions, private transfers, as well as transfers received from the state, all before deduction of income taxes and social contributions. The inclusion of social state transfers is particularly important as it means that, compared to market income, gross income already incorporates one of the two main pillars of redistribution in modern welfare states. The second central element for redistribution, taxation, is taken into account in the concept of disposable income, which is obtained by subtracting taxes and social contributions from gross income. In the following, we will refer to the difference between gross and disposable income as tax redistribution.
Figure 1 illustrates the different trends in inequality Austria, Australia, and Colombia over the last 20 years. The two high-income countries under consideration, Australia and Austria, show very similar levels of tax redistribution. Yet we can see that, as a result of more unequally distributed gross income, Australia consistently reports higher net Gini values as well. Whether the higher gross levels of inequality are primarily a result of higher market income inequality or rather of more modest levels of state transfers cannot be deduced from the numbers shown here, but earlier numbers in DART support that market income inequality is even higher in Austria, suggesting a much higher relevance of redistribution through social benefits in Austria. The overall trends in Austria and Australia are very similar. Both countries’ levels of inequality have remained relatively stable over the years, with a slight but noticeable increasing tendency. Colombia, on the other hand, displays much more erratic trends in inequality. From 2007 until 2017, we can notice a significant trend towards lower income inequality (see on explanation of the jump in inequality from 2006 to 2007 Munzi and Neugschwender (2021b) in this newsletter issue). However, much of this development seems to have come undone since then. Looking at the levels of tax redistribution, they are substantially lower in Colombia than for Austria and Australia. This, of course, is consistent with the fact that the welfare state is generally less developed and extensive in middle-income countries. Combined with the elevated levels of market income inequality in Colombia, this results in much higher disposable income inequality as compared to the two high-income countries.
Fig. 1. Gini Index Trends in Australia, Austria, and Colombia
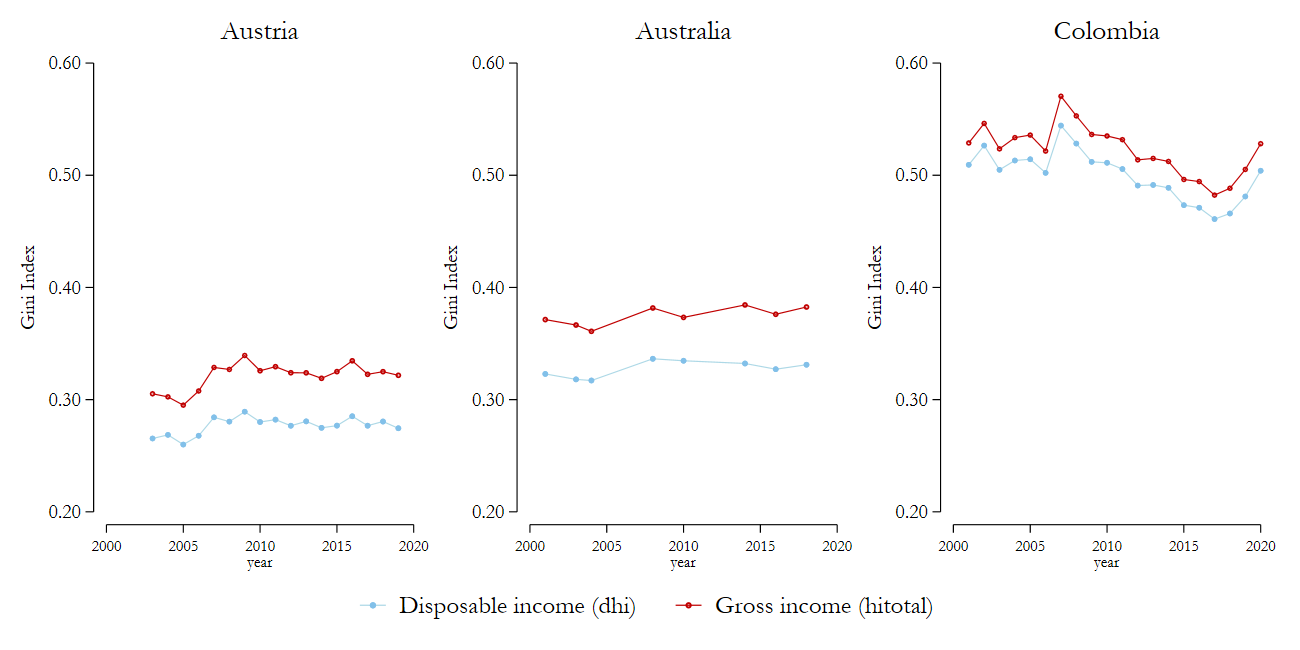
Source: Luxembourg Income Study (LIS) Database
While the Gini Index is undoubtedly a helpful indicator that aims to summarize inequality in one headline statistic, it does not tell us anything about the more nuanced distributional dynamics at play in each case. Hence, an increase in a country’s Gini Index can reflect a deteriorating economic situation of the poor, an improving economic situation only for the rich, or even a combination of the two. In order to draw a clearer picture of the primary beneficiaries of economic growth in different countries, Figure 2 looks at the development of disposable income at different points of the distribution. More specifically, we isolate income growth at three different points: percentile 10, at the median, and at percentile 90. In order to properly approximate actual improvements in the living standards of the populations involved, all trends are expressed in real terms, i.e. inflation-adjusted. For each country, the earliest year considered serves as the base year with a value equal to 100. When examining these developments, it is important to remember that we are considering disposable income. These are thus the trends after taking into account the two main redistribution mechanisms, state transfers and taxation.
Figure 2 neatly illustrates the very distinctive trends that can be observed across the considered countries. In Poland, for instance, all parts of the income distribution appear to have benefitted from the impressive real growth over the past 20 years to roughly the same degree. Even when growth slowed during the years after the financial crisis, the data suggests that the entire population was impacted to a similar extent. While growth in Australia was not as exceptionally high as in the Polish case and has noticeably levelled off over the last five years, the overall trend in Australia also reveals real growth patterns quite equally spread across the income distribution. However, the financial crisis seems to have had a stronger adverse effect on lower-income Australians compared to the rest of the population. The same can be concluded for Austria, where we can additionally notice a divergence in income growth rates between the median and percentile 90 around the middle of the observed period. Consistent with the generally stable Gini Index shown in Figure 1, however, all parts of the population seem to have benefitted rather equally from the much more moderate growth in Austria when the last two decades are evaluated as a whole.
Turning to middle-income countries, we can observe patterns of unambiguously pro-poor growth in both Colombia and Paraguay. Here, income growth has been markedly stronger for households who are at a lower part of the distribution, as compared to those at the middle and top. Overall growth was very rapid over the last 20 years in both countries, mirroring a ‘catch up’ effect. Arguably, the most striking characteristic of the trends in Colombia and Paraguay, however, is the dramatic decline of incomes in the year 2020, most likely due to the global COVID-19 pandemic. In Paraguay, the repercussions appear roughly evenly spread across the population. Trends in Colombia need to be interpreted with care. Income growth at the low end of the distribution seems to have already plummeted around the time of the financial crisis, but 2007 is the first year of a new survey series in Colombia (see Munzi and Neugschwender, 2021b). From 2008 onwards the lower part of the income distribution has seen massive income growth. However, a second significant drop over the last two years appears to have (undone) the pro-growth dynamic of years past almost entirely. In 2020, real incomes at all three considered points in the distribution have reconverged to around 30-40% above their 2001 levels. It is difficult to assess how much of this development can be attributed to the ongoing pandemic, as the negative trend was already initiated in 2019. The effects of the pandemic are, of course, far-reaching and complex and will necessitate much more time and in-depth analysis to assess properly.
Finally, taking a look at the data from Vietnam, a different pattern emerges. Despite less striking divergences between different parts of the population, we can clearly discern more robust growth at the top of the distribution than at the bottom, with both being outpaced by the median by the end of the observed period.
Fig. 2. Real growth trends in Australia, Austria, Colombia, Paraguay, Poland, and Vietnam
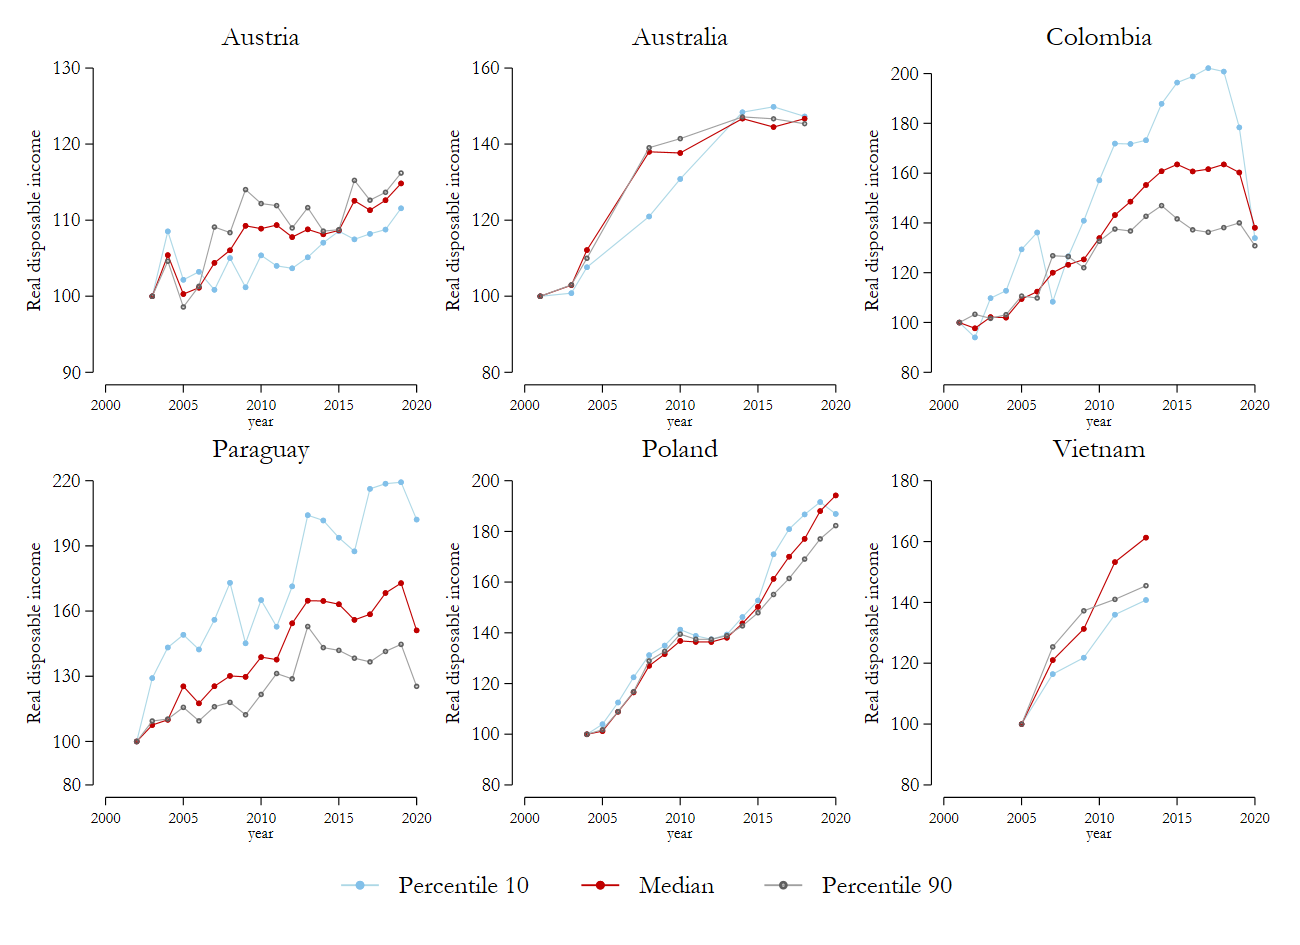
Source: Luxembourg Income Study (LIS) Database
Conclusion
This brief showcased the breadth of newly available LIS data by presenting selected evidence on the inequality trends in six middle- or high-income countries. Some broad conclusions can be drawn from this analysis.
First, taxation plays a large inequality reducing role in the high-income economies we have considered. Yet, over the last 20 years this role has not increased, and a slight but significant uptick in gross income inequality has thus resulted in a slow upwards trajectory for disposable income inequality as well. In other words, no real pro-poor growth tendencies have emerged in these countries over the last two decades. This is consistent with the analysis of Munzi and Neugschwender (2021a). In their analysis of four developed countries, only the UK showed patterns of pro-poor growth.
General trends are harder to establish for the middle-income countries we have considered. It seems clear, however, that a number of emerging economies have managed to use their dynamic growth as a force to reduce existing income inequalities. At the same time, these developments appear highly fragile, especially in times of crisis. As such, the fallout of the COVID-19 pandemic may undo a significant portion of the inequality reduction progress of the last two decades. Much more research will be needed as the data becomes available, and this will certainly be an important topic in the study of global inequalities over the coming years and decades.
1 Felix Estgen holds BSc degree in Philosophy, Politics and Economics from Vrije Universiteit Amsterdam. This article was accomplished during his internship at LIS (September-October 2021).
References
| Munzi, T. and Neugschwender, J. (2021a), Inequality Reduction in four Advanced Countries from 2000 to the late 2010s, Inequality Matters, March 2021 (Issue 17). |
| Munzi, T. and Neugschwender, J. (2021b), Harmonisation of Annual Micro Data for Colombia: Gross vs. Net and the Twilight of Inequality, Inequality Matters, December 2021 (Issue 20). |