Issue, No.19 (September 2021)
Poverty Monitoring Under Acute Data Constraints: A Role for Imputation Methods? 1
1 Introduction
Collecting data to estimate monetary poverty in low-income countries and fragile states is a challenging task. Fielding a household survey can easily cost more than a million dollars, and it often takes two or more years between initial preparations and the final calculation of monetary poverty estimates. These constraints often prevent low-income countries and fragile states from collecting data on a regular basis.
Even when survey data are collected their quality is often rather poor. While there are many reasons for the low quality of data, a common factor is that the collection of data is complicated. It requires a well-designed questionnaire, carefully planned logistics, hiring and training of qualified enumerators and supervisors, close supervision of data collection, and accurate processing of data. If all these steps are not properly followed, the quality of the data collected may be so poor that they cannot be used to estimate poverty rates.
This note discusses ways of compiling consumption or income data from the perspective of data quality and sample size. The focus is on low income countries with limited resources and capacity. Given that consumption data are more commonly collected in such countries we couch the discussion largely in terms of consumption data. However the discussion is largely applicable also to income data.
We start with a brief review of the recommendations on sample size provided in the World Bank’s Living Standards Measurement Study (LSMS) guidelines (Grosh and Munoz 1996 and World Bank 2000). These LSMS guidelines provide advice on the collection of consumption data for the purpose of poverty measurement and policy analysis. We indicate that survey samples in low income countries have been increasing in size over time – potentially affecting data quality and raising costs. We then describe two approaches that apply survey-to-survey imputation techniques aimed at saving interview time and data collection costs. We limit our focus to these two imputation methodologies, not because others don’t exist, but because they provide two examples of alternatives to the conventional approach of direct data collection that have come to receive some kind of official sanction, having been accepted for the World Bank’s global poverty monitoring effort.
Our objective in this note is to draw attention to recent exploration of imputation methods as a means to improving the quality and increasing the availability of distributional data at the country level.
2 The Living Standards Measurement Study (LSMS) guidelines
The Living Standards Measurement Study (LSMS) program guidelines recognize the challenge of collecting complex data in developing countries (Grosh and Munoz, 1996 and the World Bank, 2000). They recommend a relatively small sample of around 2000 to 5000 households for a typical LSMS survey.
The guidelines recommend a relatively small sample size in order to limit non-sampling error. They suggest that sample sizes should be large enough to produce reliable statistics at the national level, and possibly at the urban and rural level, but should not aim to produce reliable statistics at the subnational level. Increasing the size of the sample reduces sampling error but makes survey implementation significantly more difficult, resulting in a higher incidence of error in data collection and processing. Such non-sampling error is thought to likely increase in particular if the sample size is expanded and if the National Statistical Office (NSO) in a country has only limited capacity and/or experience in conducting complex surveys.
According to World Bank (2000), in the first 15 years of the LSMS program, many countries followed the general recommendations on sample size. In most countries the sample size was kept below 6000 (see Table 1). Over time, however, the situation evolved – currently, many countries, including many low-income countries and fragile states, collect data from more than 10,000 households. According to the Global Monitoring Database (2021) of the World Bank, the average sample size of all household surveys in sub-Saharan Africa used for the estimation of the international poverty measures is 10,700 households (Table 2). The average sample size in IDA countries is 10,835 households, and that of the fragile and conflict states (FCS) is 8,952 households. Table 2 also shows while sample sizes are large, data collection in most IDA and FCS countries is infrequent. More than half the countries in IDA and FCS groups are six (IDA) and seven (FCS) years old or older. As of March 2021, the most recent survey for the Central African Republic dates back to 2008.
A question is whether sample sizes of more than 10,000 are warranted in low income countries. Large sample sizes allow countries to produce more granular poverty statistics, but plausibly increase non-sampling error and survey implementation costs. Non-sampling error could be substantial, in particular, if local survey capacity is limited, where data collection occurs in settings exposed to conflict and violence, or where physical access and shortages of skilled manpower pose particular constraints. Increasing the sample size of surveys is also associated with higher implementation costs. This latter consideration is particularly important where budgets are sharply binding. Reducing sample sizes could lower survey implementation costs. This could allow surveys to be fielded more frequently, for given a fixed budget.
Table 1. LSMS Surveys in the first 15 years of the LSMS initiative
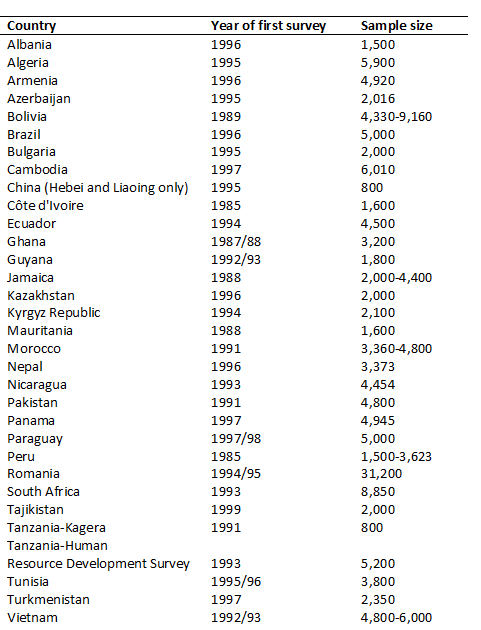
Source: World Bank (2000)
Table 2. Summary statistics of the latest household surveys in sub-Saharan Africa
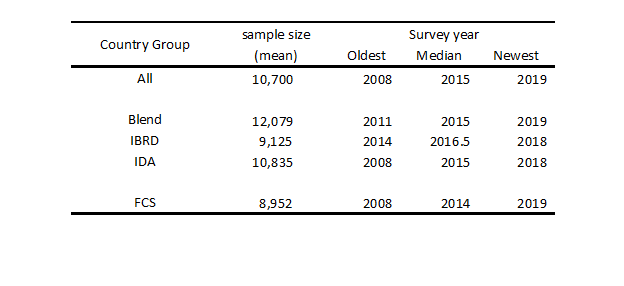
Source: Global Monitoring Database (2021) World Bank
3 Innovations in the field of official poverty data collection and estimation
Sample size consideration thus have a bearing on both the quality of household survey data and the affordability of regular data collection. It should be recognized, however, that even a modestly sized LSMS survey represents a significant burden for some low-income countries and fragile states. This has prompted exploration of additional options. Two approaches that have recently seen implementation at the World Bank are the Rapid Consumption Survey (RCS) approach developed by Pape and Mistiaen (2018) and the SWIFT 2.0 approach proposed by Yoshida et al (2020). Both aim to further reduce time and cost of data collection. As mentioned above, these two approaches have been formally incorporated into the World Bank’s global poverty monitoring efforts.
Both approaches are underpinned by survey-to-survey (S2S) imputation procedures. S2S imputation involves the estimation of an imputation model in a “training” dataset by running regressions of household expenditures or incomes on poverty proxies.
Household expenditures and poverty rates are then imputed into an “output” dataset by substituting poverty proxies of the output data into the model.
There are two key assumptions in the standard S2S methodology. First, that the relationship between household income or expenditure and poverty correlates can be expressed in an equation such as (1):
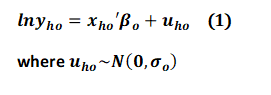
ln yho refers to a natural logarithm of household income or expenditure of household h in the output data o.xho is a (K×1) vector of poverty correlates of household h in the output data, o.βo is a (K×1) vector of coefficients of poverty correlates (Xho). uho refers to a residual and is often assumed to follow a normal distribution of N(0,σo).2 The output data includes the poverty proxy data {xho}H (h=1) but do not include household expenditures {ln yho}H (h=1), which are to be imputed. For the sake of exposition, the relationship is assumed to be linear, but this can be relaxed.
The second key assumption is that the relationship between household expenditures and poverty proxies follows the equation (1) in the training data t as well.
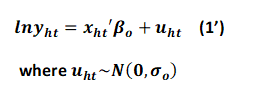
The S2S estimates parameters in equation (1’) such as (β^o, σ^o) with their distributions in the training data, draws them (β~r, u~rh) randomly from their estimated distributions, and substitutes them into equation (1) to impute household expenditures for all households in the output data. The S2S repeats this imputation (say, 100 times), resulting in 100 vectors of household expenditures (lnyrho ) in the output data. Poverty and inequality measures are estimated in each of the 100 vectors and the averages are the point estimates of poverty and inequality measures. Also using the 100 estimates, standard errors of all measures can be estimated. 3
A critical assumption in such S2S techniques is that the models underpinning the imputation from the training data set to the output dataset are stable, in the sense of the parameter estimates being appropriate for both the training and output dataset. If this assumption does not hold, a model estimated in the training data cannot reliably and accurately impute household expenditures and poverty rates into the output data.
A simple solution is to collect the training data and the output data simultaneously. If so, the model stability assumption should hold. It is important to note that the training data needs to include consumption data, which is costly and time-consuming to collect. Therefore, a key question is how to minimize the size of the sample for collecting consumption data. Both RCS and SWIFT 2.0 collect the training and output data simultaneously, but differ in terms of how the consumption data are collected. We describe the SWIFT 2.0 and RCS approaches below.
(i) SWIFT 2.0 and its application in Zimbabwe 2019
SWIFT 2.0 is the second generation version of the original SWIFT approach (Yoshida et al, 2015, 2020). In the original SWIFT approach an income model from the latest available household budget or income survey is developed, and a new data are collected only for those regressors included in that model. Household expenditure or income is then imputed into the newly collected dataset by drawing on parameter estimates from the income model. Although the original SWIFT approach has been frequently found to perform well against official poverty estimates, it depends crucially on the assumption of stability of the underlying income model. In the face of shocks, SWIFT estimates can be unreliable.
SWIFT 2.0 was introduced to overcome the model stability concern. The idea here is to field a typical LSMS survey but collect consumption data only from a small sub-sample of households (see Figure 1). An income model is developed using the small subsample data and household expenditure or income is then imputed into the rest of the sample based on that model. Since the imputation models are created from the subsample collected concurrently, there is no model stability issue.
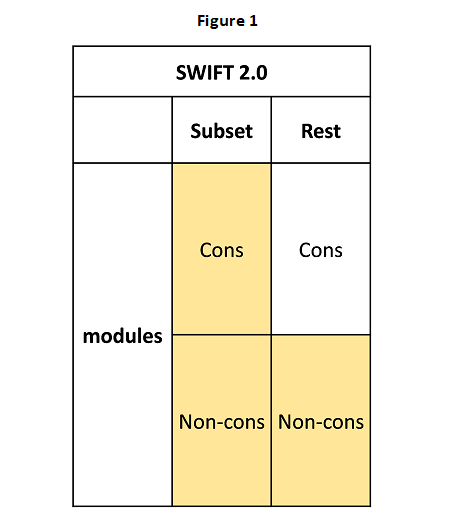
The subsample for which full consumption data are collected under SWIFT 2.0 can be very limited in size (typically less than 1000 households). Although collecting consumption from a limited sample may make it possible to ensure higher data quality, sampling error on poverty statistics estimated solely from the subsample will be larger than that obtained with a standard LSMS survey. However, following imputation of household expenditures into the rest of the sample, poverty estimates calculated after combining both actual household expenditures from the subsample with the imputed expenditures from the remaining households, may be quite precise. The ultimate success of the approach will depend on how much new (modelling) error is introduced as a result of the imputation procedure, as well as the extent to which the quality of the consumption data has improved.
A recent application of SWIFT 2.0 occurred in Zimbabwe. Zimbabwe’s latest household survey was conducted in 2017, but due to hyperinflation in 2019, there were concerns that poverty incidence might be increasing rapidly. Despite the high demand for poverty data, budget constraints prevented the country from carrying out a traditional household survey. The Zimbabwe National Statistics Agency and the World Bank agreed to apply the SWIFT 2.0 approach in order to update their assessment of poverty and living conditions of the population.
Data collection in Zimbabwe was implemented in May and June 2019. The size of the subsample in which consumption was collected was set at 600, and that of the rest of the sample was set at 3,000. Models were developed for urban and rural areas separately using the subsample data. For the subsample, both models predicted the poverty rates of urban and rural areas well. With actual and imputed data, the final poverty estimates for urban and rural areas were 24.3 and 72.0 percent, respectively. By combining both actual and imputed data, the standard errors declined from 5.1 percent to 4.4 percent for urban areas and from 4.7 percent to 2.5 percent for rural areas. The national poverty estimates for Zimbabwe in 2019, based on SWIFT 2.0, were accepted for the purpose of the World Bank’s global poverty monitoring effort.
(ii) Rapid Consumption Survey and applications in Somalia 2017 and South Sudan 2016/17
The Rapid Consumption Survey (RCS) approach introduced by Pape and Mistiaen (2018) and Pape and Wolfgang (2019), attempts to save costs and time in an alternative manner. The idea in RCS is to reduce interview time by collecting data on only a subset of consumption items and imputing the missing consumption components using S2S imputation. Poverty rates for Somalia and South Sudan based on the RCS procedure were accepted as part of the 2021 Spring update of the World Bank’s global poverty monitoring effort.
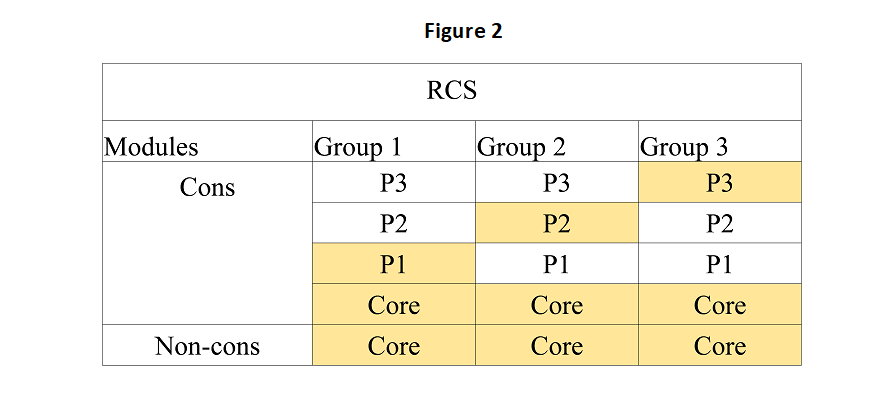
RCS splits the survey sample into three or more subsamples. For the sake of exposition, we focus on the split of 3 here. RCS then separates the consumption module into four categories – a core module and three partitions. Each subsample’s consumption module includes the core module and one partition (see Figure 2). Consumption expenditures from the dropped partitions are then imputed by models developed in the other subsamples. In the example in Figure 2, subsample 1 does not include data on partitions P2 and P3. RCS uses subsample 2’s data to develop a model by regressing household expenditure in P2 on core-consumption data and selected non-consumption indicators. It then imputes P2 expenditures into subsample 1. The same is done for imputing subsample 1’s missing consumption data of P3 by developing a model from subsample 3’s data. Similar processes are carried out to fill missing consumption data in subsamples 2 and 3.4
Since RCS does not have to collect two partitions in each subsample, data collection can be completed more quickly than with a traditional household survey. Indeed, Pape and Mistiaen (2018) claim that RCS in Somalia made it possible to collect the necessary consumption data in 60 minutes, rather than the 2 – 3 hours required for a traditional household survey.
RCS collects core consumption data for all households in the survey. Expanding the core module has a clear and positive impact on the accuracy of the final poverty estimates. However, there is a trade-off: expanding the core module increases the data collection time. At the extreme, if the core module is expanded to the full consumption module, RCS does not save any time. Therefore, in RCS, determining how to split the full consumption module into the core module and partitions is important.
(iii) Comparisons between RCS and SWIFT 2.0
While both RCS and SWIFT 2.0 are less exposed to model stability issues than a simple S2S approach by creating models from the same household survey as the imputation data, how they save interviewing time does differ. In RCS, total interview time is reduced because no household is administered the full consumption questionnaire – sampled households are administered only (varying) sections of the consumption module. In SWIFT 2.0, the total interview time is reduced because consumption data are collected only in the subsample. The relative appeal of SWIFT 2.0 over RCS increases as more households are included in the overall survey relative to the consumption subsample, while the relative benefit of SWIFT 2.0 declines as the number of partitions in RCS increases.
(iv) Comparison between traditional data collection and imputation approaches
As noted above, the LSMS guidelines (Grosh and Munoz 1996 and World Bank 2000) recommend that the overall sample size for a household consumption survey should be kept small, in order to balance between sampling and non-sampling errors. An imputation approach such as SWIFT 2.0 would permit a larger overall sample size, as long as the consumption sub-sample is kept modest in size. At first glance, SWIFT 2.0 is more cost-effective than the traditional LSMS because it does not collect consumption data from most of the sample. However, this comparison does not consider the overall statistical accuracy of the final poverty estimates. SWIFT 2.0 does not collect consumption data from a large subsample of the survey but instead imputes consumption data into the non-consumption data. Since the imputations are not perfect, the procedure introduces a certain level of imputation (model) error, to be that needs to be added to the sampling error. While sampling error affects both the traditional and imputation approaches, modelling error enters into only the imputation approaches. To achieve the same level of statistical accuracy as in the traditional approach, an approach such as SWIFT 2.0 would thus require a larger sample than the traditional approach, generating a smaller sampling error that can offset the additional imputation errors. Thus cost-effectiveness of the SWIFT 2.0 approach depends on the savings achieved from collecting non-consumption data only for the S2S projections and how many more observations the SWIFT 2.0 needs to be collected in order to achieve the same level of statistical accuracy as the traditional approach. Fujii and van der Weide (2016) demonstrate that for SWIFT 2.0 to be more cost-effective, the cost of collecting data needed for the S2S poverty projections should be considerably lower than that of collecting the full consumption data.
How realistic it is to assume the cost of collecting the data needed for the S2S projection is only a small fraction of the cost of collecting full consumption data? To impute household expenditures with the S2S projection method, it often suffices to collect only 10 to 15 simple questions, most of which depend only on a yes/no answer. Experience to date indicates that collecting such information may require only three to five minutes. This compares with two hours or more which may be required for collecting full consumption data. However, Fujii and van der Weide (2016) argue that transport costs are also likely to enter into the calculation. Even if the interview time shrinks by adopting the SWIFT 2.0 approach, if transportation costs remain high, the relative advantage of SWIFT 2.0 is attenuated because both the traditional approach and SWIFT 2.0 will incur the same transportation costs per cluster or enumeration area. Moreover, since SWIFT 2.0 needs a bigger sample size to achieve the same level of statistical accuracy, higher total transportation costs are needed, potentially making SWIFT 2.0 less cost-effective than the traditional approach. On the other hand if SWIFT 2.0 is able to collect data via phone interviews or employing local enumerators to collect non-consumption data, then the role of transportation costs might be attenuated.
Moreover, if collecting the non-consumption data for the S2S projections has its own objective, the marginal cost of collecting variables needed for poverty projection declines, making SWIFT 2.0 more attractive. A multi-topic, integrated, household survey like an LSMS has multiple purposes. Estimation of monetary poverty is only one of many objectives. Monitoring education and health outcomes, the coverage of social assistance policies, non-monetary dimensions of deprivation, and employment conditions, are all important facets of the multi-topic household survey. It is often the case that the questionnaire for collecting non-monetary data includes most of variables needed for projecting monetary poverty. If so, the incremental cost of collecting variables for the purpose of poverty projections becomes negligible. However, it is also important to note that while expanding the questionnaire so as to include additional non-monetary indicators significantly reduces the marginal cost of collecting poverty proxies, it does increase total survey costs, and time, considerably.
4 Concluding remarks
Poverty data gaps remain widespread in the developing world. For example, the latest database of the World Bank shows there are 35 countries out of 46 countries in the sub-Saharan Africa region that do not have poverty data in the last 5 years. Since poverty incidence can change quickly, particularly after large shocks such as the COVID-19 pandemic, there is an urgent need to achieve more frequent monitoring of poverty. However, the frequent collection of poverty data is challenging for many developing countries, particularly low income countries and fragile states. This is because the collection of poverty data is costly, time-consuming, and complex. This note revisits recommendations in the traditional approach to collecting Living Standard Measurement Study (LSMS) surveys (Grosh and Munoz, 1996 and the World Bank, 2000) and discusses two methodologies – RCS and SWIFT 2.0. – that have recently seen adoption in the World Bank’s official global poverty monitoring effort.
This article notes that the LSMS guidelines recommend relatively small sample sizes in order to minimize the risk of non-sampling error and its implications for data quality and credibility. Recent years have seen a drifting up of sample sizes, with for example the average sample size of the latest household surveys in the sub-Saharan region exceeding 10,000 households. If the LSMS guidelines were returned to, the cost of data collection could be significantly reduced and the risk of non-sampling error significantly curtailed.
This note then discusses two alternatives, both involving survey-to-survey (S2S) imputation. These two methods have recently been implemented to produce official poverty estimates in South Sudan, Somalia, and Zimbabwe. The note assesses under what conditions methodologies such as the SWIFT 2.0 and RCS approaches discussed here, become more cost-effective than traditional data collection. Given that poverty projections based on S2S include imputation errors, a given overall level of precision may entail larger overall sample sizes than the traditional approach. And so cost-reductions are not assured. However, emerging experience suggests that standard survey implementation costs can be substantially reduced if interview time for collecting data for the S2S projections is kept to an absolute minimum and if transportation and lodging costs can be saved via phone interviews or hiring local enumerators. Further research and exploration is warranted.
1This note summarizes findings and discussion in Lanjouw and Yoshida (2021). These were also presented by Lanjouw in the LIS Summer Lecture on July 6, 2021. Helpful comments and suggestions have been received from Chris Elbers and Philippe van Kerm, and participants in the Summer Lecture. We are also grateful to participants at the World Bank online presentation on June 16, 2021.
2This normal distribution and linearity can be relaxed. For the sake of exposition, the normal distribution is assumed.
3S2S has been used widely in the field of poverty measurement and monitoring. Deaton and Dreze (2002) and Kijima and Lanjouw (2003) used this approach to estimate poverty rates in India’s National Sample Survey Organization survey of 1999-2000. Stifel and Christiaensen (2007) used it to impute poverty into a Demographic Health Survey. Douidich et al. (2013) used it to impute poverty into multiple rounds of Labor Force Surveys in Morocco.
4More details are available in Pape and Mistiaen (2018).
References
| Christiaensen, L., P. Lanjouw, J. Luoto, and D. Stifel. (2012). “Small Area Estimation-Based Prediction Methods to Track Poverty: Validation and Applications.” Journal of Economic Inequality 10 (2): 267–97. |
| Deaton, A. and J.P. Dreze. (2002). “Poverty and Inequality in India: A Reexamination” Economic and Political Weekly, September 7, 2002. |
| Fujii, T. and R. van der Weide. (2020). “Is Predicted Data a Viable Alternative to Real Data?” The World Bank Economic Review 34(2): 485–508. |
| Grosh, M. and J. Munoz. (1996). “A Manual for Planning and Implementing the Living Standards Measurement Study Survey.” Living Standards Measurement Study Working Paper Series No. 126. World Bank, Washington, DC. |
| Kijima, Y. and P. Lanjouw. (2003). “Poverty in India during the1990s – a regional perspective,” Policy Research Working Paper Series No. 3141. World Bank, Washington, DC. |
| Lanjouw, P. and Yoshida, N. (2021) “Extraordinary Times and Extraordinary Measures: High Frequency Poverty Monitoring in the Face of Data Deprivation”, mimeo, Poverty and Equity Global Practice, the World Bank. |
| Mathiassen, A. (2013). “Testing Prediction Performance of Poverty Models: Empirical Evidence from Uganda,” Review of Income and Wealth, International Association for Research in Income and Wealth, vol. 59(1), pages 91-112, March. |
| Pape, U, and J. Mistiaen. (2018). “Household Expenditure and Poverty measures in 60 minutes: A new approach with results from Somalia.” Policy Research Working Paper Series No. 8430. World Bank, Washington, DC. |
| Pape, U. and P. Wollburg. (2019). “Estimation of Poverty in Somalia Using Innovative Methodologies.” Policy Research Working Paper Series No. 8735. World Bank, Washington, DC. |
| Sohnesen, T. (2015). Tracking Poverty via Consumption Proxies. Mimeo. Stifel, D., and L. Christiaensen. (2007). “Tracking Poverty over Time in the Absence of Comparable Consumption Data.” World Bank Economic Review 21 (2): 317–41. |
| The World Bank. (2000). Designing Household Survey Questionnaires for Developing Countries – Lessons from 15 yars of the Living Standards Measurement Study. Edited by M. Grosh and P. Glewwe. World Bank, Washington, DC. |
| Yoshida, N., R. Munoz, A. Skinner, C. Kyung-eun Lee, M. Brataj, and D. Sharma. (2015). SWIFT Data Collection Guidelines version 2. World Bank, Washington, DC. |
| Yoshida, N., X. Chen, S. Takamatsu, K. Yoshimura. S. Malgioglio, and S. Shivakumaran. (2020). “The Concept and Empirical Evidence of SWIFT Methodology.” Unpublished Manuscript. World Bank, Washington, DC. |