Issue, No.18 (June 2021)
A Brief Look at Consumption Expenditure Patterns of (Low-Income) Households in Europe
The European Union (EU) has long considered economic and institutional convergence as important goals. Since its establishment, the regional integration of EU markets has continued to widen and deepen, thereby acting as an important force of socio-economic convergence among the member countries (Ridao-Cano & Bodewig, 2019). In this regard, the concept of convergence has been a central element in EU policy and a topic of both social and academic interest. Since the seminal papers of Abramovitz (1986) and Barro and Sala-I-Martin (1992), the occurrence of convergence is commonly analysed – particularly in the context of the EU integration process – in terms of indicators such as GDP per capita, labour productivity and household disposable income. Despite this extensive analysis, however, little attention is paid to household consumption expenditure and its structure.
Studying the patterns and disparities of household consumption expenditure structures provides insights into general consumption behaviour and is thus an important source of information on people’s living conditions and the choices and restrictions that are related to these conditions. When people make decisions regarding what to consume, and how much they want to borrow or save, they do not only consider their current income, but also how much savings they have accumulated and how much they expect to earn over the rest of their lifetime. In this way, the household consumption expenditure decisions that are made over a given period, can provide more information about people’s living standards than data about income viewed in isolation. This can serve to better inform us about how unequal a society really is.
In this note, an investigation is provided on how the household consumption expenditure shares change across EU countries, and whether there is convergence of consumption expenditure behaviour among them over time. The investigation includes an overview of how convergence trends change when only lower-income households are considered.1 Using a sigma-convergence indicator, the dispersion of household consumption expenditure shares among EU countries was measured2 over two periods of five years: 2005–2010 and 2010–2015. Estimates were based on Eurostat HBS data on household consumption expenditures shares at the national level. Consumption expenditures were distributed across seven categories: food and drinks, clothing and footwear, housing, transport, communication, restaurants, hotel, recreation and culture, and others.3
Before statistically examining the dispersion of household consumption expenditure shares, it is useful to have a preliminary look at the data for each country in 2005, 2010 and 2015 (see Table 1). Overall, the largest consumption share refers to expenditures on housing, food and drinks and restaurant, hotel, recreation and culture. Naturally, there are deviations between the countries: for example, Romania, Bulgaria, Greece, Estonia, Latvia and Lithuania appear to devote a much larger share of their consumption on food than other countries over time. In contrast, share of food consumption in Finland and Denmark is less than half the size of the Romanian one. Housing seems to be more homogeneous across countries, even though household in Malta appears to spend less than half the share of Hungary’s on housing. Sweden and Austria are the ones which spend the most in restaurant, hotel, recreation and culture, while Romania and Bulgaria spend less than four percent. Budget limitations due to lower levels of income are reflected in the structure of households’ consumption expenditure as the share of essential goods and services (housing and food and drinks) increase considerably across all countries.
The above overview indicates that differences in expenditure between EU countries exist and can be large at times. Nevertheless, these shares are not very revealing as they stand since differences in prices may explain a large share of the above deviations. In addition, the lack of identical expenditure structure is not to be expected among countries. Therefore, our main focus is not discussing whether there are differences in shares, but whether these shares are becoming more similar among countries over time. For this purpose, sigma-convergence was analysed using the coefficient of variation (CV). Figure 1 shows the development of the measure as calculated for EU countries, and as a comparison between all and low-income households, for the period of 2005–2015.
Figure 1. Changes in the CV for household consumption expenditures shares: EU countries, 2005-2010, 2010-2015
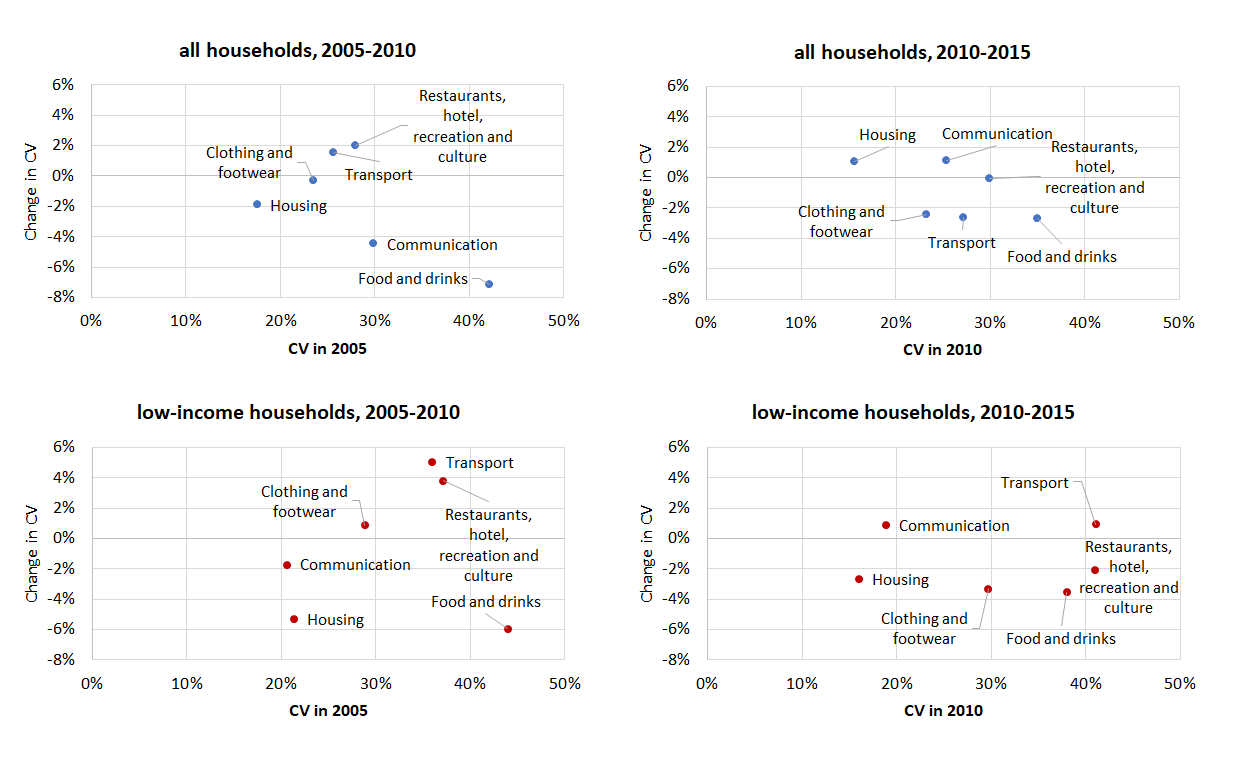
Note: The CV is the ratio of the standard deviation to the mean, and it is generally expressed as a percentage. It is the most commonly used indicator for sigma convergence and is calculated as the ratio between the standard deviation and the mean of all units of observations. The higher the CV, the greater the level of dispersion around the mean. As it does not have units, it allows for a comparison between the distribution of values whose scales of measurement are not comparable.
Source: Authors’ own calculations based on household consumption expenditure data derived from Eurostat.
Figure 1 shows that expenditure convergence was more prevalent than divergence for the period of 2005–2010. The CV of household consumption expenditure shares decreased for food and drinks, communication, housing and clothing and footwear until 2010. The highest decrease has been registered for food and drinks. This was related with the initial value of the CV measured in the base year 2005, when food and drinks registered the highest level of disparities, while housing and clothing and footwear had relatively lower levels of disparities (expressed by low levels of the CV). Convergence remained predominant after 2010, but the CV decreased for different shares: food and drinks, transport, clothing and footwear and restaurants, hotel, recreation and culture. Food and drinks continued to register the highest decrease, alongside transport.
Similar evolution with higher disparities (expressed by higher levels of the CV) was observed in the case of low-income households. For the period of 2005–2010, convergence prevailed with the CV of household consumption expenditure shares decreasing for food and drinks, housing and communication. The highest decrease was again registered for food and drinks, followed shortly by housing. Expenditure convergence also remained predominant for the period of 2010–2015, but the CV decreased for food and drinks, clothing and footwear, housing and restaurants, hotel, recreation and culture. This time, food and drinks, clothing and footwear and housing registered the highest decrease.
The period-data analysed, which included the great recession period (from 2008 to 2012), presented an opportunity to observe the changing consumption patterns of Europeans when facing an economic shock. A common consequence of periods of recession is the inability of many consumers to maintain their previous levels of consumption. There is consensus among researchers that consumers’ level of expenditure is severely affected by a recession. Many consumers may, among others, change their consumption patterns by replacing the purchase of luxury goods with that of necessities, buying less of certain non-essential goods, driving less and switching to public transport, and abandoning or reducing an ostentatious social life. Consequently, long-term trends of convergence were only verified for expenditures on food and drinks, clothing and footwear (for all households) and housing (for low-income households). The higher level of disparities shown by low-income households seems to confirm that consumption expenditure patterns can highlight differences in living standards in Europe, as budget limitations due to lower levels of income are reflected in the structure of households’ consumption expenditure. However, it is important to point out that these results must be interpreted with great caution due to the use of national averages for countries.
Table 1. Structure of consumption expenditure by consumption purpose: in Europe, percent
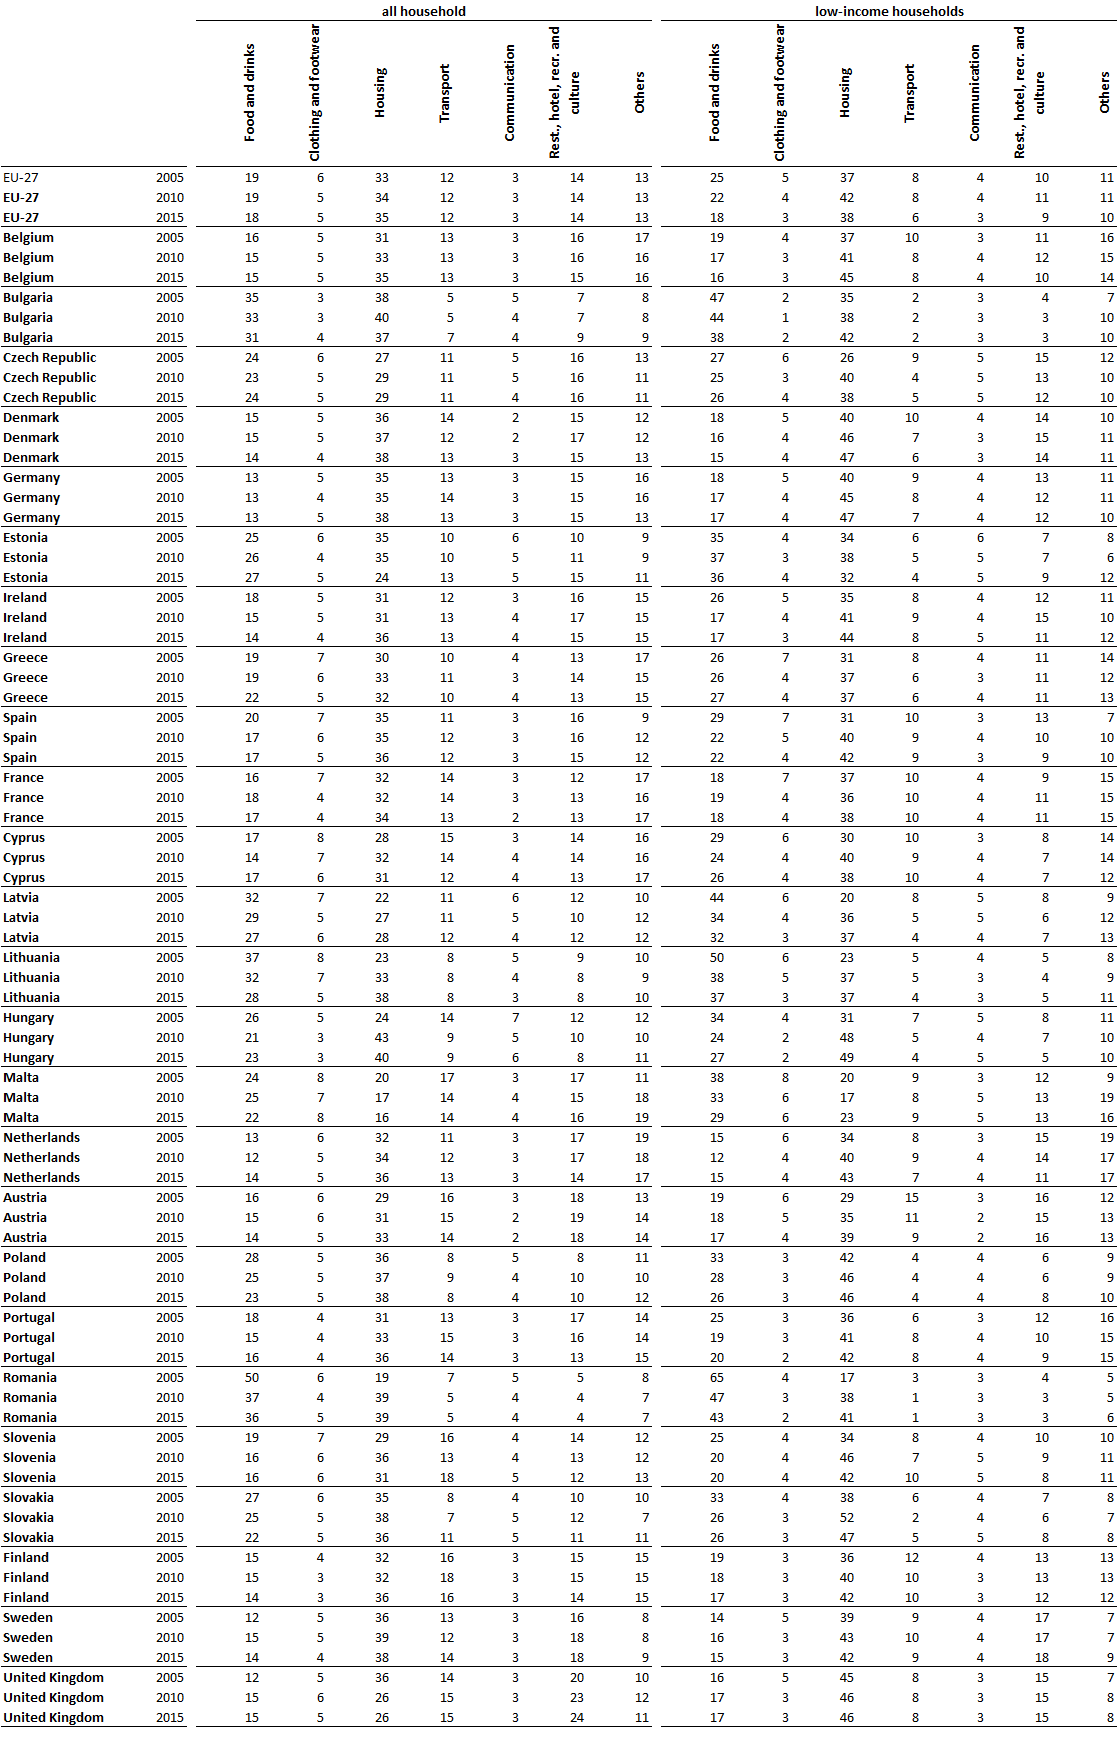
Source: Authors’ own calculations based on household consumption expenditure data derived from Eurostat
1 Households that belong to the bottom 20 percent of the households ranked by income.
2 We considered the EU-27 (2007–2013) list of member states: Austria, Belgium, Bulgaria, Cyprus, Czech Republic, Denmark, Estonia, Germany, Greece, Spain, Finland, France, Hungary, Ireland, Latvia, Lithuania, Malta, the Netherlands, Poland, Portugal, Romania, Slovakia, Slovenia, Sweden, and the United Kingdom. At the time of this analysis, consumption expenditure by income quintiles was not available for Italy (for 2010 and 2015) and Luxembourg (for 2010).
3 Food and drinks includes expenditures on food, non-alcoholic beverages, alcoholic beverages, tobacco, and narcotics. Housing includes expenditures on housing, water, electricity, gas/heating and other fuels, combined with furnishings, household equipment and routine household maintenance. Others includes expenditure on health, education and miscellaneous goods and services. The level of expenditure on education and health is influenced by national education and health policies that vary significantly across countries with respect to tuition fees payments and the degree to which governments finance health and education. Figures could thus be misleading in such cases. Because of that, sigma-convergence was not investigated for others.
References
| Abramovitz, M. (1986). Catching up, forging ahead and falling behind, J. Econ. Hist, 46 (2), 385–406. |
| Barro, R.J. and Sala-I-Martin, X. (1992). Convergence, J. Polit. Econ, 100 (2), 223–251. |
| Ridao-Cano, C. and Bodewig, C. (2019). How Can Europe Upgrade Its “Convergence Machine”? Intereconomics Review of European Economic Policy, Volume 54,· Number 1 · pp. 11–18. DOI: 10.1007/s10272-019-0784-5 |