Issue, No.18 (June 2021)
Higher Education Expansion and Inequality in Labour Incomes: The Importance of a Gendered Perspective
Tertiary education has been expanding in the second half of the 20th century worldwide, and particularly in high-income countries. While higher educational achievement leads to higher earnings for individuals — and is without much of a doubt a “good thing” — what it implies for the overall distribution of labour income is, however, no simple story. It is not at all clear whether educational expansion has been fuelling the growth in income inequality that has been observed in many countries over the last decades or whether, on the contrary, it played a mitigating role.
In a study conducted within the framework of the (LIS)2ER project1we examined LIS data for 27 countries between 1995 and 2015 to describe how the distribution of labour incomes earned by tertiary and non-tertiary educated workers compare and, accordingly, what educational expansion potentially implies for labour income inequality. It turns out that the effect of tertiary education expansion is gender-specific, highlighting trade-offs between different dimensions of inequality.
Empirical regularities in educational expansion
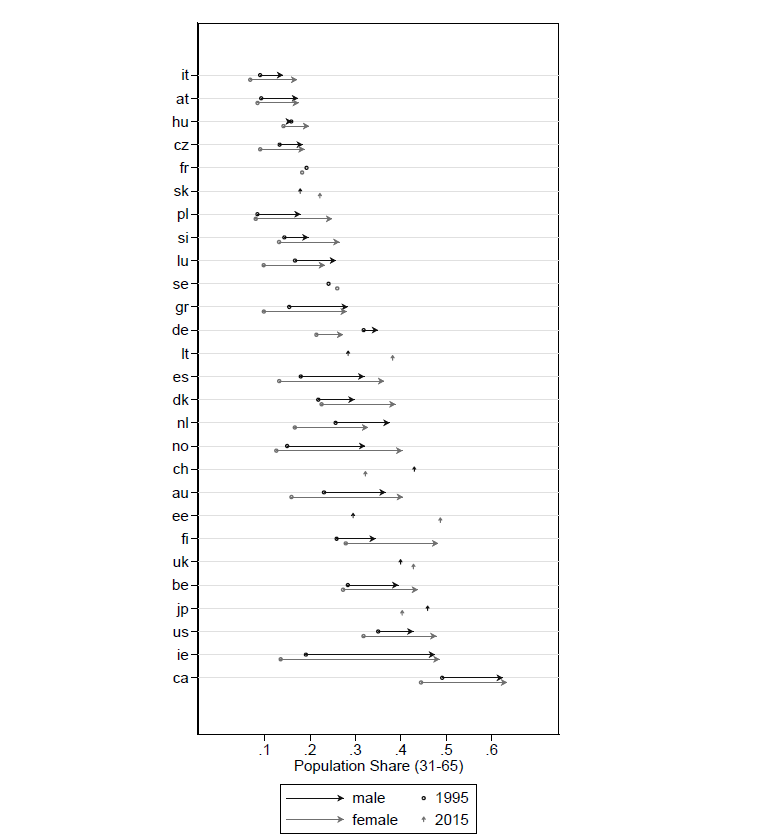
Figure 1 shows estimates around 1995 and 2015 of the share of men and women aged between 31 and 65 with tertiary education in 27 high-income countries for which we have data in LIS. 2 This unveils some empirical regularity.
Tertiary education expanded in all countries. However, there is substantial variation in both the level and the growth of tertiary education attainment. In 1995, just 7% of individuals reported tertiary education in Italy against 47% in Canada. The range further widened over time and extends from 8% in Italy to 63% in Canada in 2015. While Canada has the highest share of tertiary educated in our series, Ireland experienced the largest expansion with increases in the proportion of tertiary graduates by 28 and 35 percentage points for males and females respectively. By contrast, Italy not only has the smallest proportion of tertiary educated in both time periods, but is also among the countries – with Austria, Germany, Hungary and the Czech Republic – which recorded relatively little change over time.
Figure 1 also makes it clear that women have outpaced men with regard to their educational attainment. In 1995 it was only in Northern European countries (Denmark, Finland and Sweden) that women had higher shares of tertiary education graduates. By 2015, women have higher rates of tertiary education than men in all countries, except Germany, Greece, Japan, Luxembourg and the Netherlands.
Fig.1. Tertiary Attainment 1995-2015

Notes: This figure has been generated wit Stata; the syntax to generate this figure and the underlying data table are available for download here.
Source: Luxembourg Income Study (LIS) Database.
The “Paradox of Progress”
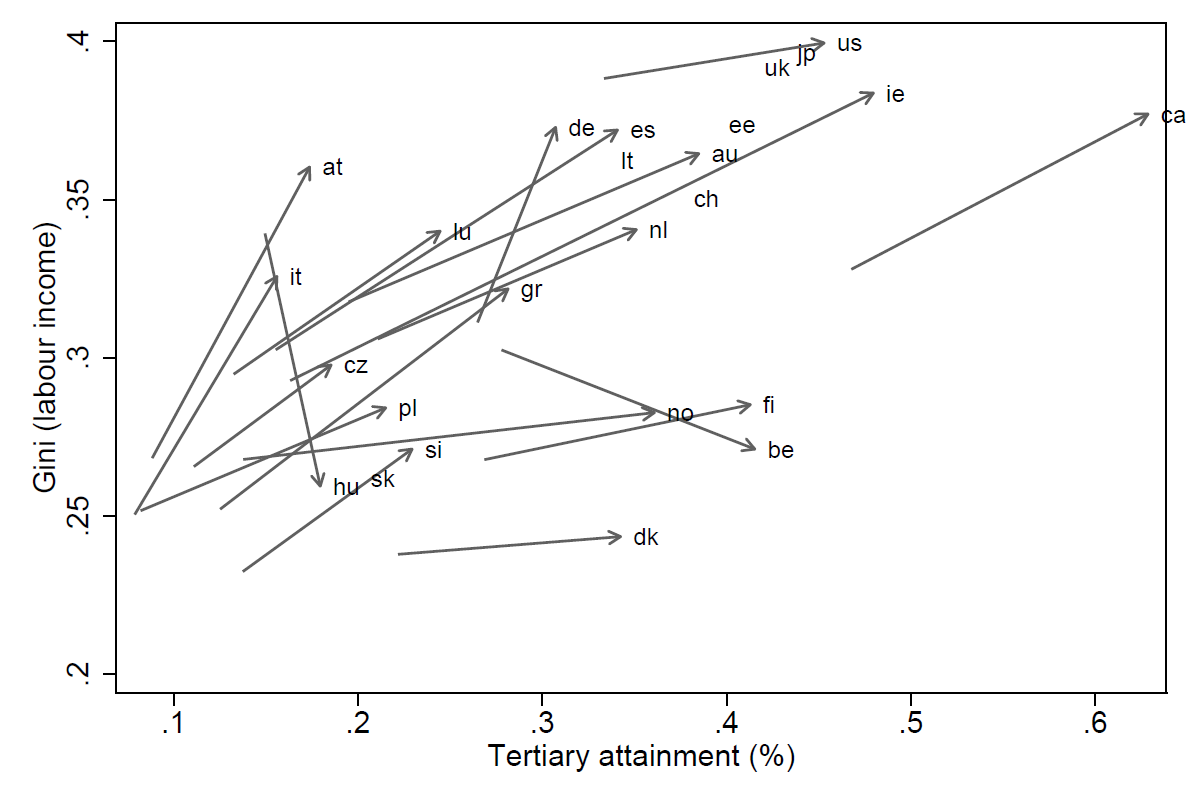
Plotting the educational expansion measures against the Gini coefficient of labour income, 3 Figure 2 illustrates what Bourguignon et al. (2004) called “The Paradox of Progress”: Tertiary education expanded over 20 years, but at the same time inequality in labour incomes increased in almost all countries – with variations. The rise in inequality was relatively small in some Nordic countries but reveals quite large in countries such as Germany, Austria and Italy, which only experienced modest increases in the share of tertiary education graduates. Only in Belgium and Hungary do we see a decline in the Gini coefficient.
Fig.2.Labour Income Inequality vs. Tertiary Attainment

Notes: This figure has been generated wit Stata; the syntax to generate this figure and the underlying data table are available for download here.
Source: Luxembourg Income Study (LIS) Database.
Education and labour income inequality
Since the 1990s, policy recommendations based on the implications of the human capital model and skill-biased technological change – prominently depicted in the exposition of Goldin and Katz (2010) about a “Race Between Education and Technology” – have seen the cure for rising income inequality in increasing educational attainment. The inequality-reducing force of educational expansion is derived from the expectation that increasing the supply of graduates reduces the relative return to tertiary education in the context of high demand due to technological change. At the same time, as economists have noted, expansion may have also generated an increase in the demand for higher education by fostering further technological change biased towards skilled workers (Acemoglu 2002). This, on the contrary, must have pushed the returns to education upwards – an inequality-increasing force.
Sociological research, which has accounted for processes of social structuring, has provided evidence of other forms of potentially adverse inequality outcomes from educational expansion (Attewell and Newman 2010). If it is the wealthy who are overrepresented in the tertiary segment of the education structure, policies encouraging the expansion of higher education – intentionally or unintentionally – may have disproportionately benefited them; for example if the greater political support of their interests allows status groups to retain their comparative advantage by ensuring that credentials from prestigious Universities retain their distinctiveness and/or by sorting children from disadvantaged socio-economic backgrounds into low-level/low-quality tracks. Research has shown that inequalities by background have indeed strengthened at the tertiary level (Blanden and Macmillan 2016).
The implications of these sorting mechanisms may be aggravated if labour markets do not fully absorb the rising number of graduates – an argument that has been put forward by the literature arguing overeducation to be increasingly prevalent in high-income countries (Bar-Haim, Chauvel, and Hartung 2019). Thus, even if the return to tertiary education might decline on average, income losses and gains can be unequally distributed among increasing numbers of tertiary education graduates.
The distributive impact of higher education expansion
How educational achievements shape the distribution of labour income depends on three factors. Considering two educational groups (tertiary and non-tertiary) the first factor concerns the difference in incomes between the two groups of workers and how much more highly educated workers earn on average. The second is the income distribution within each group. The third is, simply, the share of the population in each group.
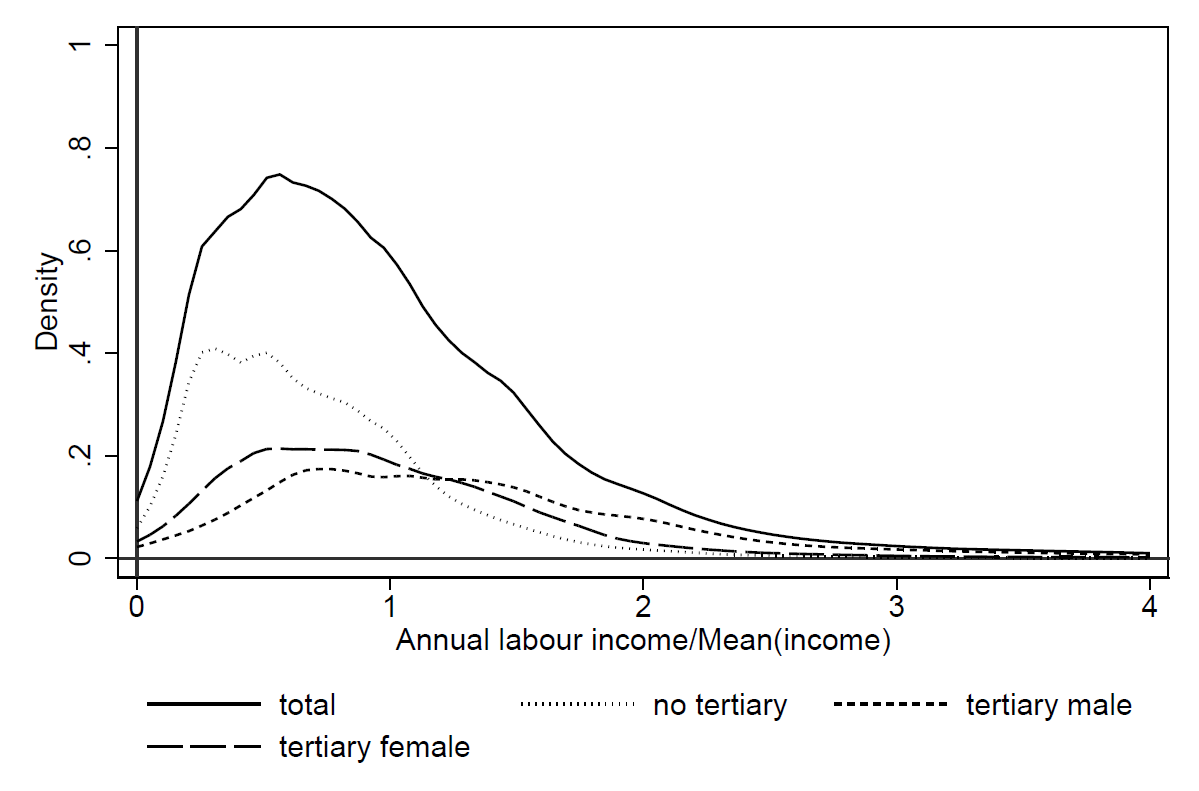
Figure 3 illustrates how these three factors interact to mechanically shape the relationship between educational attainment and the aggregate income distribution. For Ireland in 2015, it shows the (unconditional) density function of labour incomes together with the densities conditional on not being tertiary educated, on being a tertiary educated man and on being a tertiary educated woman. Each conditional density has been multiplied by the share of the group in the population so the three lines for the conditional densities add up to the unconditional density.
Fig.3. (Un)conditional Densities, Ireland 2015

Source: Luxembourg Income Study (LIS) Database.
An immediate way to think about how educational expansion can affect the overall distribution of labour income is by considering a shift of density mass from the lower education distribution to the higher education distribution. The impact of varying the relative shares of the three groups depends on the locations and size of the underlying densities relative to each other (Jenkins and Van Kerm 2005). Since the densities of tertiary educated workers — and especially of male tertiary educated workers — are concentrated towards higher incomes, an increase in their share would move the unconditional density higher up, all else being equal. An increase in the share of female tertiary educated workers would not be so strong since their density is generally not located as high up as men’s and is closer to the density of the non-tertiary educated.
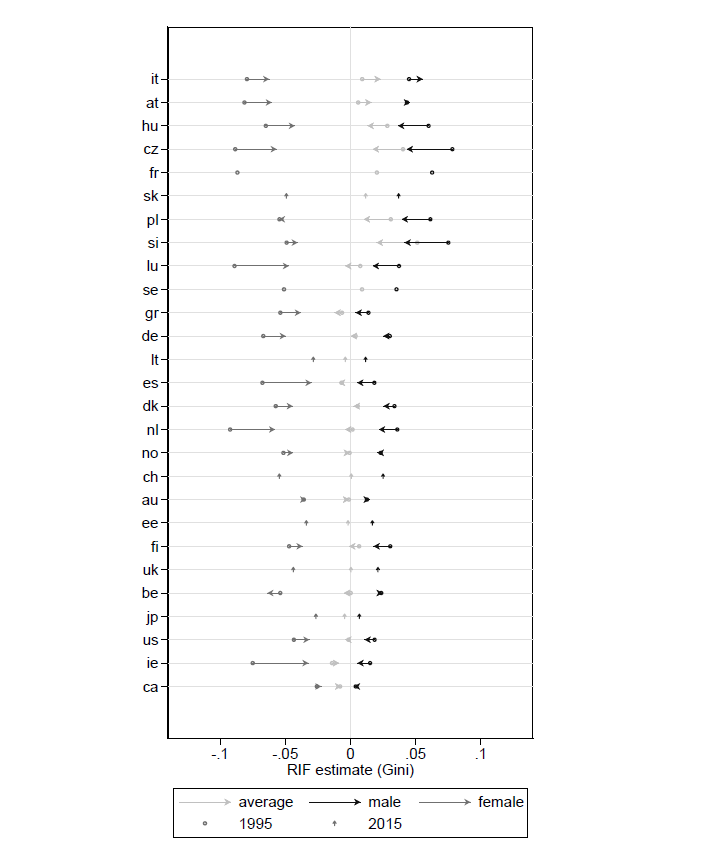
The effect of such density shifts on various inequality measures (or other distributive indicators) is what a technique known as Recentered Influence Function (RIF) regression captures (Firpo, Fortin, and Lemieux 2009; Choe and Van Kerm 2018). We therefore used RIF regressions to project the impact that (marginally) increasing the share of tertiary educated workers, on average and separately for men and women, would have on the Gini coefficient in all 27 countries and for the two time points we have data for. The results are shown in Figure 4. The estimates are scaled such that they can be interpreted as the predicted impact on the Gini coefficient of a 10 percentage point increase in the population share of tertiary educated workers, and a corresponding 10 percentage point decrease in the proportion of non-tertiary educated workers.
Fig.4. Distributive Effect 1995-2015

Source: Luxembourg Income Study (LIS) Database.
Again taking Ireland in 2015 as example, given the locations of the conditional densities relative to each other, increasing the share of tertiary graduates by 10 percentage points would mechanically reduce the Gini by 0.9%. However, this aggregate impact hides important differences by gender. Increasing female attainment would reduce the Gini by up to 3%, while increasing male attainment would increase the Gini by 0.5%. With -7% and +1.4%, respectively, the impact of both, males and females, were also of opposed signs but were larger in 1995.
The empirical regularity of results across countries is remarkable, even if magnitudes differ. Distributive effects ignoring gender tend to be small; they are not significantly different from zero in 11 countries. But these conceal large gender differences. The impact on the Gini coefficient of increasing tertiary attainment of men is positive and significant but the impact of increasing tertiary attainment of women is negative and significant. These estimates shrink towards zero over time for both genders.
What explains the opposite signs for men and women is the shape of education- and gender-specific income distributions: mechanically, the more tertiary educated men and women contribute to the tails of the distribution (at the top and/or the bottom), the more unequally incomes are distributed among them, and the larger the positive effect is on the Gini coefficient. It is thus the lower income levels of women relative to men and their small contribution to the upper end of the distribution (exemplified in Figure 3) that explains the diverging distributive estimates by gender.
Discussion and policy implications
Our results suggest that no such thing as an average distributive effect exists, but that the impact on labour income inequality may be dependent on whether educational expansion mostly comes from men or women. Note that one can read these results as yet another piece of evidence of the earnings disadvantage of women, since they are driven by the fact that tertiary educated men and women shape the bottom, top and middle part of labour income distributions differently: tertiary educated women are located in the middle and the bottom while tertiary educated men mostly form the upper tail.
Many factors that have been extensively discussed in the literature on gender wage or earnings gaps continue to be relevant at the highest educational level and can thus help to explain these results. Besides lower employment rates and working hours this includes, among other things, occupational segregation. Empirical evidence from Bar-Haim et al. (2018) who also used LIS data suggests that employment status and occupation have become increasingly important components of gender earnings gaps in high-income countries, while the role of educational attainment has declined. Recent evidence for the US (Addison, Chen, and Ozturk 2020) indicates that the type of job men and women do differs, as women are more likely to work in occupations which require a lower skill set as compared to the level they had attained through their college education, and that this occupational skill mis-match explains a substantial share of the gender wage gap.
Not very many studies have had a focus on the differential position of women, and the tertiary educated in particular, in different segments of the income distribution. Looking at the bottom, extensive evidence has revealed the higher prevalence of poverty among women, but with little treatment of the higher educated in this respect. Looking at the top, research points to the existence of a “glass ceiling” so that wage gaps are most pronounced in the upper tail (Arulampalam, Booth, and Bryan 2007). Nonetheless, according to the very recent evidence of Burkhauser et al. (2020), over the last decades women have made up an increasing share of top 1% income earners in the UK, and their rising educational attainment is the major factor in the explanation of this trend.
Our results also indicate that considering vertical and horizontal inequalities simultaneously can provide valuable insights. Taking the gender-specific nature of the effects of educational expansion into account highlights potential policy trade-offs. Taken at face value, our results suggest that policies aimed at reducing overall income inequality might entail expanding female higher education, as long as it leaves the location and dispersion of their labour incomes constant. This conflicts with policy goals aiming to improve the labour market prospects of tertiary educated women. Conversely, a focus on gender equality would entail trying to close the earnings gap at the top but this may be at the cost of increasing overall labour income inequality. This is a reminder that taking account of potential conflicting policy goals between different dimensions of inequality is important in pursuing wider social equity aims.
1The (LIS)2ER initiative intends to intensify inter-institutional collaboration between LIS and LISER. It is facilitated by the funding support of the Luxembourg Ministry for Higher Education and Research (MESR).
2The classification of tertiary education follows ISCED 2011 mappings (http://uis.unesco.org/en/isced-mappings). For each country we pool surveys over a five-year window around 1995 and 2015 respectively. The number of surveys varies across countries. We do not observe all countries in both time periods, either because no survey is available for the time window or because no comparable data on educational attainment or labour income is available (Switzerland, France and Sweden are only observed around 1995; Estonia, Japan, Lithuania, Slovakia and the UK are only observed around 2015.)
3Labour income includes income from dependent employment or self-employed work. Zero and top 1% incomes are excluded. The sample contains people aged 31-64 who pursued any employment activity in the current period.
References
| Acemoglu, D. (2002). “Technical Change, Inequality, and the Labor Market.” Journal of Economic Literature 40 (1): 7–72. |
| Addison, J. T.; Chen. L.; Ozturk, O. D. (2020). “Occupational Skill Mismatch: Differences by Gender and Cohort.” ILR Review 73 (3): 730–67. https://doi.org/10.1177/0019793919873864. |
| Arulampalam, W.; Booth, A. L.; Bryan, M. L. (2007). “Is There a Glass Ceiling over Europe? Exploring the Gender Pay Gap across the Wage Distribution.” ILR Review 60 (2): 163–86. https://doi.org/10.1177/001979390706000201. |
| Attewell, P. and Newman, K. S. (2010). Growing Gaps: Educational Inequality around the World. Growing Gaps. New York: Oxford University Press. https://oxford.universitypressscholarship.com/view/10.1093/acprof:oso/9780199732180.001.0001/acprof-9780199732180. |
| Bar-Haim, E.; Chauvel, L.; Gornick, J. C.; Hartung, A. (2018). “The Persistence of the Gender Earnings Gap: Cohort Trends and the Role of Education in Twelve Countries.” 737. LIS Working Paper Series. |
| Bar-Haim, E.; Chauvel, L.; Hartung, A. (2019). “More Necessary and Less Sufficient: An Age-Period-Cohort Approach to Overeducation from a Comparative Perspective.” Higher Education 78 (3): 479–99. https://doi.org/10.1007/s10734-018-0353-z. |
| Blanden, J. and Macmillan, L. (2016). “Educational Inequality, Educational Expansion and Intergenerational Mobility.” Journal of Social Policy 45 (4): 589–614. https://doi.org/10.1017/S004727941600026X. |
| Bourguignon, F; Ferreira, F. H. G.; Lustig, N. (eds.) (2004). The Microeconomics of Income Distribution Dynamics in East Asia and Latin America. Washington, DC: [New York]: World Bank; Oxford University Press. |
| Burkhauser, R. V.; Hérault, N.; Jenkins, S. P.; Wilkins, R. (2020). “What Accounts for the Rising Share of Women in the Top 1%?” IZA DP No. 13359. |
| Choe, C. and Van Kerm, P. (2018). “Foreign Workers and the Wage Distribution: What Does the Influence Function Reveal?” Econometrics 6 (3): 41. https://doi.org/10.3390/econometrics6030041. |
| Firpo, S.; Fortin, N.; Lemieux, T. (2009). “Unconditional Quantile Regressions.” Econometrica 77 (3): 953–73. https://doi.org/10.3982/ECTA6822. |
| Goldin, C. and Katz, L. F. (2010). The Race between Education and Technology. Illustrated Edition. Cambridge, Massachusetts London, England: Belknap Press: An Imprint of Harvard University Press. |
| Jenkins, S. P. and Van Kerm, P. (2005). “Accounting for Income Distribution Trends: A Density Function Decomposition Approach.” The Journal of Economic Inequality 3 (1): 43–61. https://doi.org/10.1007/s10888-004-8309-1. |
