Issue, No.15 (September 2020)
Some changes in the LIS PPPs: A brief look at the methodology and income rankings for selected regions in the LIS database
In an increasingly globalised world, there is a growing demand for cross-national studies comparing living standards and well-being. One such effort is the UN’s 2030 Agenda for Sustainable Development, which has set a target to end extreme poverty by 2030. While more and more detailed data is available globally, initiatives like these are faced with significant comparability issues. For example, to measure progress in poverty reduction, monetary values not only need to be expressed in a common currency but also reflect different prices faced by individuals in each country over time. Cross-country price differences and various distortions in the international currency market make the currency exchange rates unsuitable for such an exercise because they are likely to underestimate the standard of living in developing countries.
One common solution is to use purchasing power parity (PPP) rates. These convert a local currency into an amount of foreign currency that would buy the same bundle of goods and services in all countries in a given year. By far the largest international database of PPP rates is provided by the International Comparison Program (ICP), which is an initiative led by the World Bank that aims to improve the cross-country comparability of income data. The most recent PPP deflators are published in the World Development Indicators (WDI). In May 2020, WDI released PPP rates that convert local currency units into 2017 US PPP dollars, which were calculated using updated data on expenditures, regional composition, population and market exchange rates. In addition to this, the previously used 2011 PPPs were revised due to National Accounts rebasing, a common practice used to obtain more accurate estimates of the size and structure of an economy.
Currently, LIS provides the most recent PPP estimates on household final consumption expenditurei for the benchmark years 2011 and 2017. In addition to this, users can access information on the domestic consumer price index (CPI) deflators with both reference years 2011 and 2017, as well as LIS PPPs that combine changes in price levels within countries over time with spatial PPP deflators, making it easy to express local currency values in 2011 and 2017 USD PPP. While income and wealth measures published in the LIS visualisation tool DART since July 2020 use the 2017 PPPs, the updated 2011 PPPs are also available for LIS users. 2011 PPPs can be used with LIS data to produce estimates of absolute poverty comparable to those calculated by the World Bank, which will keep using the revised 2011 purchasing power parities rather than the 2017 PPPs until further notice (see World Bank blog post for details). A recent paper by Atamanov et al. (2020) discussed the implications of the change in the benchmark year on global poverty estimates, concluding that 2017 PPPs would lead to a reduction in the global poverty count.
In this article, we raise the following question: How are the LIS figures affected by the choice of the PPP benchmark year? To answer this question, we prepared various figures analysing the difference between the 2011 and 2017 PPPsii . Figures 1, 2 and 3 show trends in the equivalised median household disposable income for three regions: Northern Europe, Southern Europe and Latin America. All the values are expressed in 2017 international dollars. In the left-side panel, monetary values are first expressed in 2011 international dollars using the countries’ consumer price index (CPI) and the 2011 revised PPP deflators and then updated to 2017 international dollars using the CPI of the United States iii. In the right-side panel, all monetary values are expressed in 2017 international dollars using countries’ CPI and the 2017 USD PPPs. By comparing right and left-side panels, we can see how the purchasing power parities have changed for each country. For example, Norway’s purchasing power has been adjusted downwards after introducing the 2017 PPPs, which means that with the same amount of income in Norway one can buy fewer goods than previously thought (Figure 1). The same is true for Sweden, which saw real income drop due to the change in PPPs. Due to the changes in purchasing power parities in Sweden and Norway, Norway only overtook Denmark as regards real equivalised household disposable income about 5 years later (2006 compared to 2001), and Sweden’s income no longer catches up with that of Finland’s in the early 2000s.
Figure 1. Trends in real income in the Northern European countries
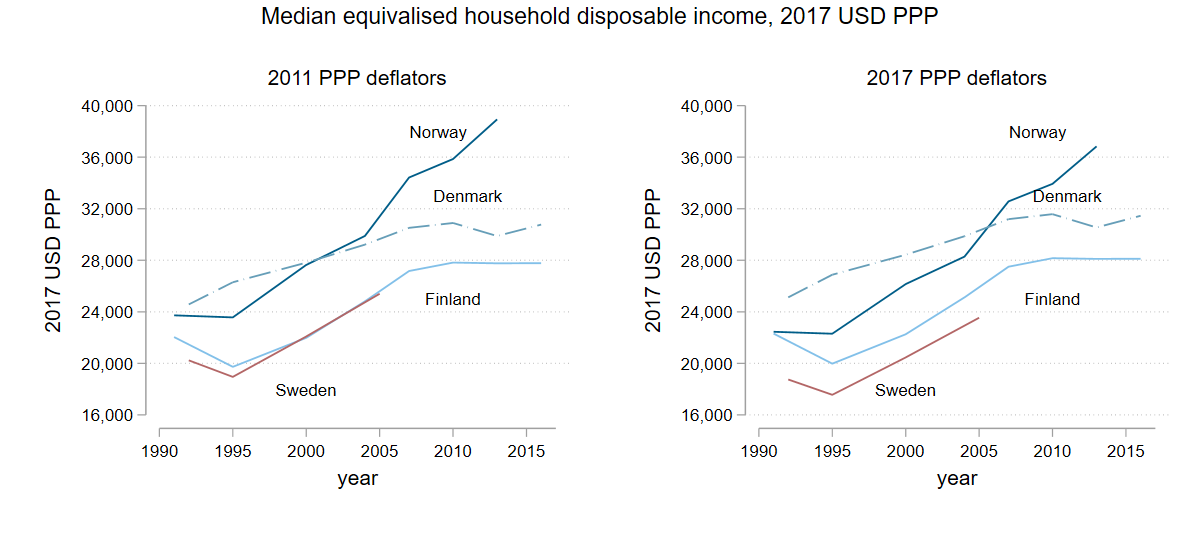
Source: LIS database.
Some changes in the real income rankings due to the new PPPs can also be observed in the Southern European countries (Figure 2). With 2017 PPPs, all Southern European countries in the LIS database had their purchasing power adjusted upwards with respect to the international dollars. However, the change has not been uniform, with the largest increase in real income in Spain, and the lowest in Italy, leading to some changes in the country rankings. Interestingly, using the 2017 methodology, Greece and Italy switch income rankings in 2005 and then again just before the Great Recession of 2008. In addition to this, when 2017 PPPs are applied the median equivalised household disposable income in Spain ranks higher than that of Italy since 1998, but the countries change rankings several times using the 2011 revised PPPs.
Figure 2. Trends in real income in the Mediterranean countries
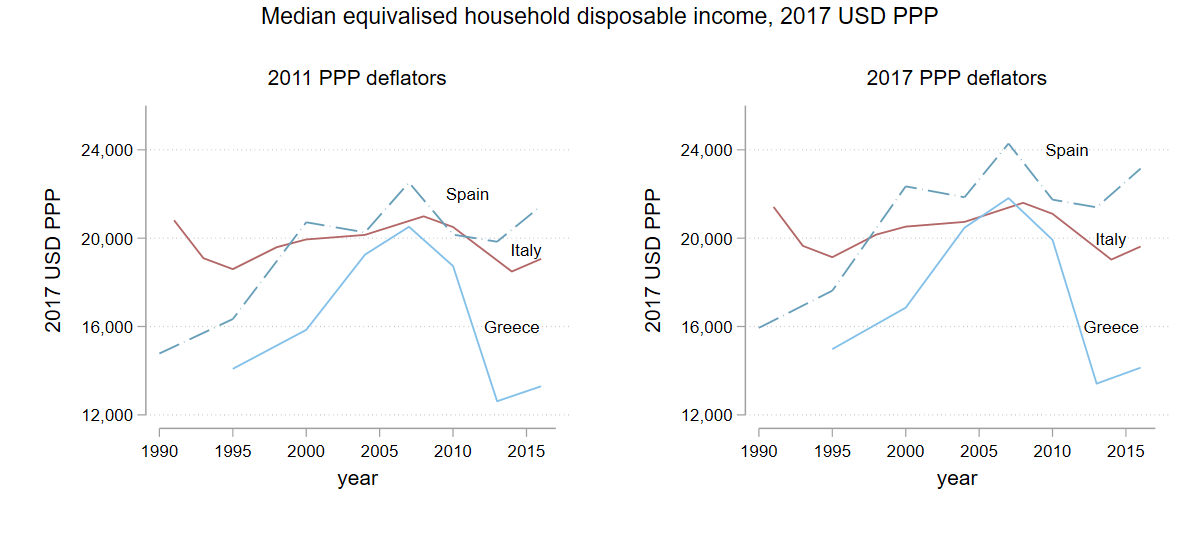
Source: LIS database.
Finally, Figure 3 shows trends in real income in Latin American countries using both sets of purchasing power parities. Among the Latin American countries, Chile has had the largest downward adjustment of incomes due to the 2017 PPPs. However, the change in PPPs in Chile only has an impact on country rankings for the early 1990s, when, using the new PPPs, the real median equivalised household disposable income in Chile surpassed that of Mexico a few years later. In addition to this, some minor changes in the timing of when the country rankings changed can be observed in Peru, Uruguay, Brazil and Mexico.
Figure 3. Trends in real income in the Latin American countries
Source: LIS database.
Overall, the introduction of 2017 PPPs has led to some changes in the country rankings in the LIS data with respect to the median equivalised household disposable income in each country. However, such changes only affect indicators that use absolute monetary values, as the relative poverty and inequality indicators remain unchanged with the new PPPs. With both 2011 and 2017 PPPs directly available via the remote data execution system LISSY, LIS users can explore income and wealth data using both sets of PPPs.
More information on the LIS PPP deflators can be found on the LIS website and in the Online Tutorial Series.
i PPP conversion factor, private consumption (LCU per international $) (https://data.worldbank.org/indicator/PA.NUS.PRVT.PP)
ii Underlying data for all countries in the LIS database can be downloaded at /wp-content/uploads/files/nl-2020-15-im-data-ppp.xls.
iii For example, median equivalised household disposable income in Norway in 2013 (359341.5 Norwegian Kroner) is divided by the change in its consumer price index between 2011 and 2013 (102.83/100) and the 2011 PPPs (9.78) (or simply by the LISPPP factor of 10.057), and then multiplied by the change in the consumer price index in the US between 2011 and 2017 (108.97/100).
References
| Atamanov, A., Lakner, C., Mahler, D. G., Tetteh Baah, S. K., & Yang, J. (2020). The Effect of New PPP Estimates on Global Poverty: A First Look. |