Issue, No.14 (June 2020)
Why Is Old-Age Poverty on the Rise in Lithuania? A First Look at the Annual LIS Data Series for 2009-2017
In the recent LIS working paper, Ebbinghaus, Nelson and Nieuwenhuis (2019) looked at poverty trends in old age in a number of high-income OECD countries. They found a steady decline in old-age poverty in the 2000s in most of the countries analysed, leading to a convergence in poverty rates among the working age population and the elderly. Contrary to these trends, LIS Key Figuresi show that old-age poverty in Lithuania has been on the rise since 2010. The newly released annualised LIS data series from Lithuania for 2009-2017 gives us an opportunity to have a closer look at the poverty trends among the elderly and identify some of the factors behind these trends.
Social insurance in Lithuania can be dated back to 1926 but a universal state pension insurance scheme was not implemented until 1995ii . During the Soviet period of 1945-1990, Lithuania did not have a separate social insurance budget. Old-age, survivors and invalidity pensions were granted from the USSR state budget to individuals reaching retirement age (50 years old for women and 55 years old for men) and persons who had completed full years of service. After the establishment of the Central State Social Insurance Board in the independent Lithuania (SoDra), a pension reform took place in 1995. Initially, the system took over the retirement age from the Soviet system but this was gradually increased.
Currently, Lithuania has a two-tier public pension scheme, comprised of a flat-rate benefit and an earnings-related component, adjusted each year based on the growth rate of the wage fund. In 2014, a voluntary funded pension scheme became available, enabling residents to channel a part of their social insurance contributions into private pension funds. The minimum number of years of social insurance contributions required to qualify for a public pension is 15 years. In 2017, the retirement age was 63 years and 6 months for men and 62 years for womeniii, and a full rate basic pension was granted with 30 years of contributions. In the same year, the basic pension was 120 EUR per month and the average pension with full insurance contribution record was 291.1 EUR per month (Navicke and Cizauskaite, 2018; SoDra, 2020)iv. The inadequacy of these old-age benefits and the high poverty rates among the elderly have led to a pension reform in 2018 (European Commission, 2018).
Figure 1 shows trends in relative poverty in the Lithuanian population and by age groups. Income is measured by adding all personal and household income after taxes and transfers and adjusting for household composition using the LIS equivalence scale (square root of the household size). Individual equivalised income is then compared to the relative poverty line equal to 50% of the median equivalised disposable income in a given year. While poverty rates of children and adults under 64 years old fluctuated in the period 2009-2017, a nearly five-fold increase in poverty in old age was responsible for a slight upward trend in poverty in the Lithuanian population. This means that the elderly at the bottom of the income distribution did not see their incomes rise at the same rate as individuals in the middle of the national income distribution.
Figure 1. Relative poverty rate in Lithuania in 2009-2017 by age group
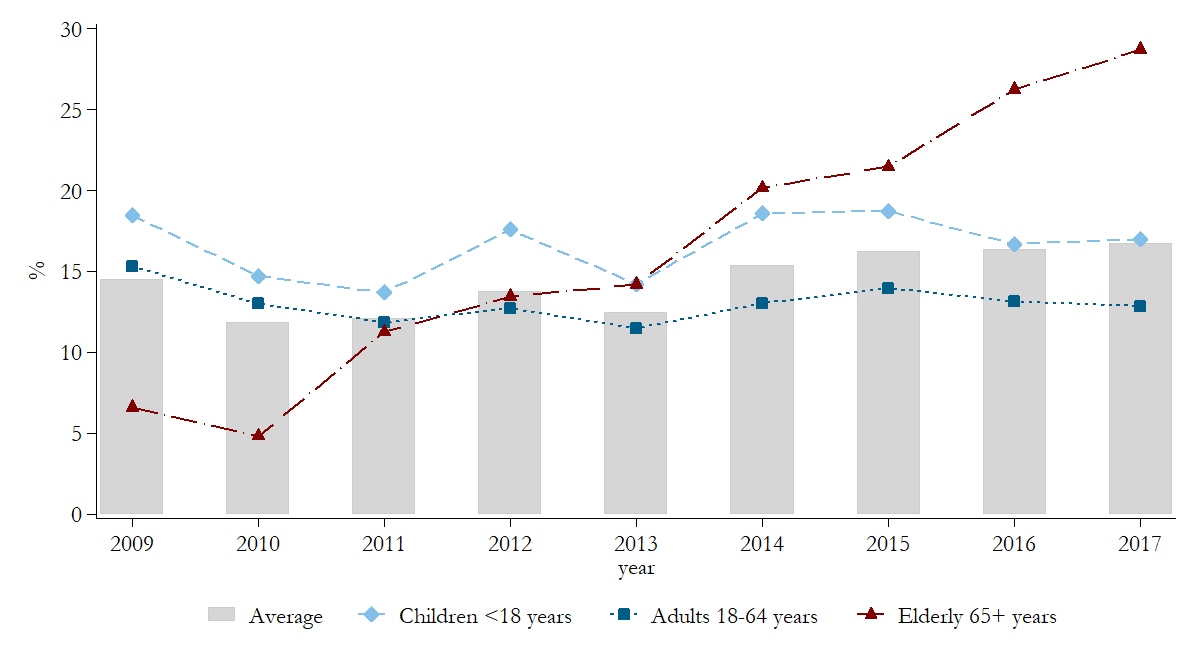
Note: The figure shows trends in relative poverty by age group. Poverty is defined as income below 50% of median equivalised household disposable income in a given year. Source: LIS Database.
Figure 2 offers a potential explanation for increasing poverty rates among the elderly. As the Lithuanian economy started recovering from the Great Recession of 2008, monthly wages were steadily rising. This happened not only due to the growth in the economy but also due to institutional changes in the minimum wage, which was raised from 232 EUR in 2012 to 380 EUR in 2017. At the same time, pensions remained largely unaffected. The basic monthly pension stood at 105 EUR until 2015 and was increased only slightly until it reached 120 EUR in 2017. Due to this, the rise in the old-age pensions did not keep up with the income growth of the majority of the population, which is why we see a steady increase in the relative poverty rates among the elderly in 2010-2017.
Figure 2. Monthly pension and wage in Lithuania in 2009-2017, EUR
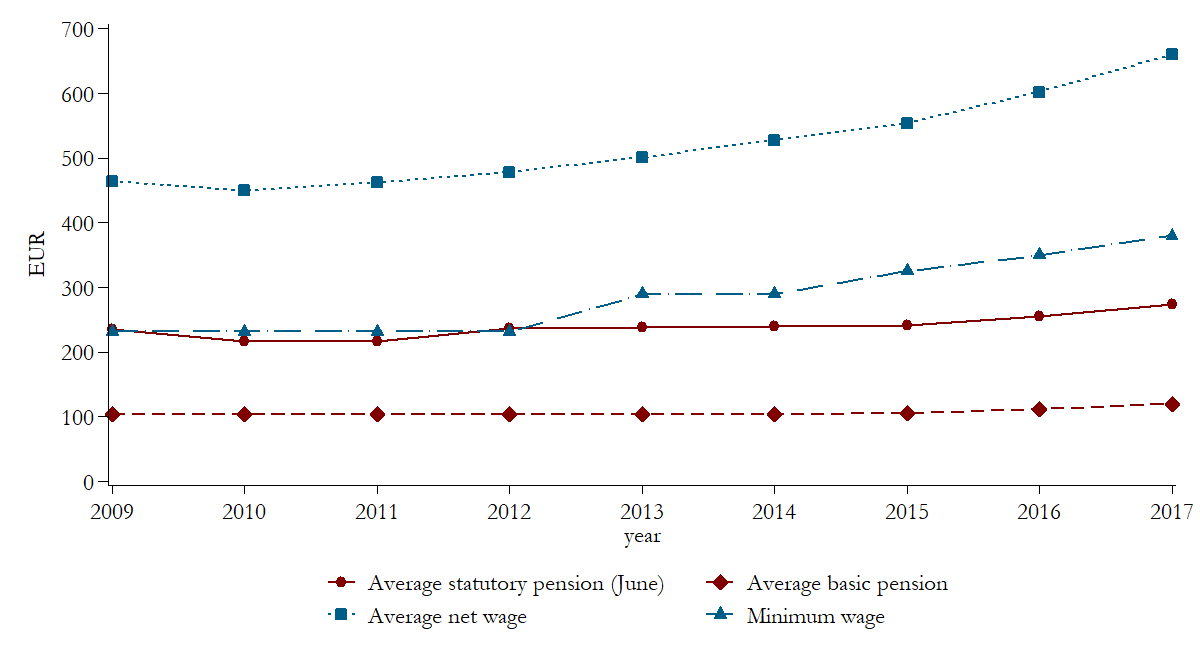
Note: Basic monthly pension and minimum monthly salary amounts were retrieved from Lazutka, Navicke, and Salanauskaite (2012) and Navicke and Cizauskaite (2018). Average statutory pension was retrieved from SoDra (2020). Average net wage was retrieved from Statistics Lithuania (2020).
Whether the elderly were more likely to become poor during the analysed period depended largely on the household composition. Figure 3 shows that while poverty rates among the elderly living in composite households rose only slightly, it was the elderly living alone who suffered the most. The increase in relative poverty was especially pronounced for women in single households. By 2017, about 60% of women living alone were in relative poverty, compared to less than half of men living alone. The differences in poverty rates among elderly women and men are not surprising: women tend to have shorter employment histories and earn lower incomes compared to men, which result in lower old-age pensions. However, though present, the gender gap in old-age benefits in Lithuania is not considered large from an EU perspective (European Commission, 2018).
Figure 3. Relative poverty rate among the elderly in Lithuania in 2009-2017 by sex and household type
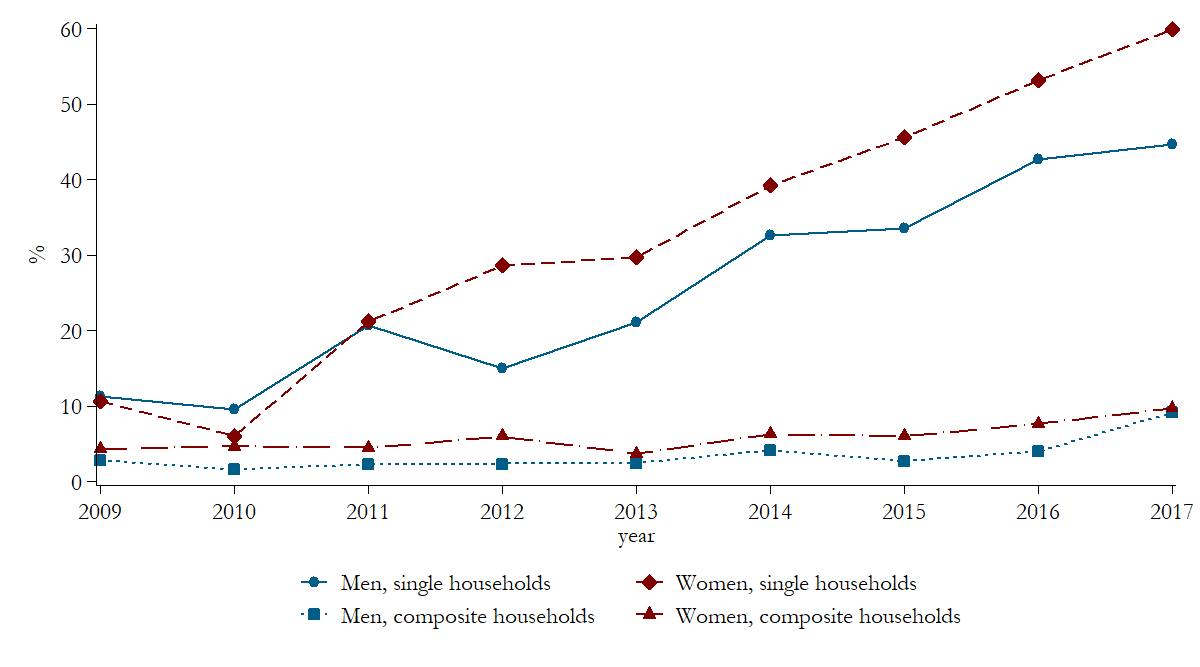
Note: Poverty is defined as income below 50% of median equivalised household disposable income in each country in a given year. Source: LIS Database.
Lastly, Figure 4 shows the differences in the composition of disposable income among old-age individuals by poverty status. First, we see that poor individuals primarily rely on old-age pensions as their source of income. Only less than 10% of their income came from other sources such as labour, capital, private transfers and other social transfers. On the other hand, among the elderly living above the poverty line, pensions comprise less than two-thirds of disposable income, while labour income comprises around 30%. Second, in the period 2009-2017, the share of labour income among non-poor elderly individuals steadily increased, while it slightly declined among the poor. This suggests that while pensions stagnated, the only way for those who were close to the poverty line not to fall into poverty was to increase income from other sources, mainly labour. This does not mean that the elderly had to necessarily go back to work; it merely explains that old-age individuals living in composite households were much better protected against poverty than the elderly living alone due to the labour income of other household members. In addition to this, the share of capital income in total disposable income among non-poor individuals was higher than among poor individuals, which suggests that poverty can be reduced by promoting savings in old-age.
Figure 4. Composition of disposable income among the elderly by poverty status in Lithuania in 2009-2017, %
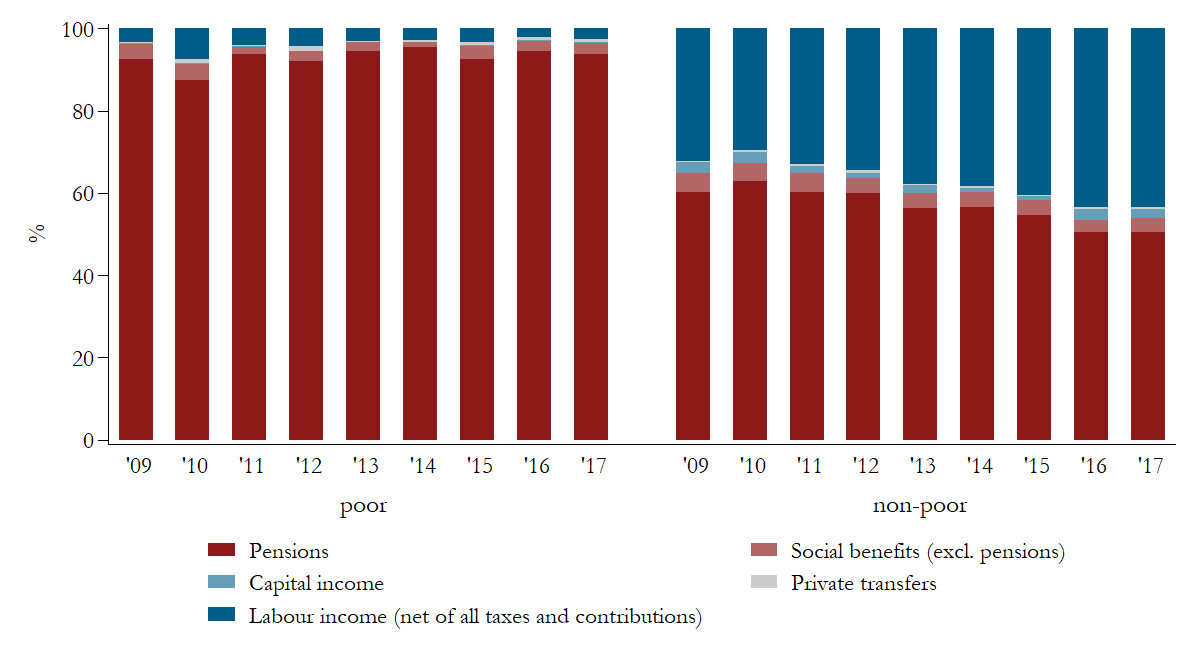
Note: Pensions include private and public old-age pensions, social assistance pensions, survivor benefits and work injury pensions granted to individuals older than the statutory retirement age. For the sake of simplicity, all taxes and social insurance contributions are subtracted from labour income. Poverty is defined as income below 50% of median equivalised household disposable income in each country in a given year. Source: LIS Database.
Overall, we found that stagnating pensions and increasing wages in the Lithuanian economy were largely responsible for the steady growth in relative poverty rates in old age in Lithuania during 2009-2017. Even though the statutory minimum wage was gradually raised from 2013 on, pension benefits saw only a marginal increase starting from 2016. In particular, old-age individuals living in single households and primarily relying on pension income were significantly more likely to fall into poverty, especially single women. Since 2018, several pension reforms have taken place in order to address the inadequacy of income protection in old age, including an increase in the basic pensionv . Due to this, we might see a reversal of the poverty trend among the elderly from 2018 on, once the new waves of LIS data for Lithuania become available. However, ensuring adequate income protection in old age will remain a challenge in Lithuania in the coming years as the country struggles with increasing old-age dependency ratios.
i LIS Key Figures can be accessed at: /data-access/key-figures/
ii A more detailed description of the history of the social insurance system in Lithuania is available on the website of the Central State Social Insurance Board https://www.sodra.lt/lt/socialinis-draudimas/sodros-istorija.
iii Retirement age in Lithuania has been gradually increasing year on year by 2 months for men and 4 months for women until it reaches 65 years in 2026.
iv Public pensions in Lithuania are not subject to personal income tax and social security contributions (OECD, 2019).
v For example, between April 2017 and April 2020, the average statutory pension increased from 274 to 376 EUR (SoDra, 2020).
References
| Ebbinghaus, B.; Kenneth N.; Nieuwenhuis, R. (2019). ‘Poverty in Old Age’, LIS Working Papers Series, No.777. |
| European Commission (2018). The 2018 pension adequacy report: Current and future income adequacy in old age in the EU. Volume II: country profiles, https://doi.org/10.2767/653851. |
| SoDra (2018). Socialinis draudimas Lietuvoje 1926 – 1940 metais, Retrieved from: https://www.sodra.lt/lt/socialinis-draudimas/sodros-istorija. |
| SoDra (2020). Statistical data website: Pensions, Retrieved from: https://atvira.sodra.lt/en-eur/. |
| Lazutka, R.; Navicke, J.; Salanauskaite, L. (2012). ‘EUROMOD country report: Lithuania (LT), 2007-2011’, Retrieved from: https://www.euromod.ac.uk/sites/default/files/country-reports/year3/CR_LT_2007-2011_final.pdf. |
| Navicke, R. and Cizauskaite, A. (2018). ‘EUROMOD country report: Lithuania (LT), 2015-2018.” (2018)’, Retrieved from: https://www.euromod.ac.uk/sites/default/files/country-reports/year9/Y9_CR_LT_Final.pdf. |
| Statistics Lithuania (2020). Indicators database, Retrieved from: https://osp.stat.gov.lt/statistiniu-rodikliu-analize#/. |
| OECD (2019). Pensions at a Glance 2019: Country profiles – Lithuania (2019), https://doi.org/10.1787/b6d3dcfc-en. |