Issue, No.12 (December 2019)
The Role of Non-Labor Household Income in Shaping Inequality Trends in Spain
The growing disparities in the distribution of household incomes over the course of the past decades in most OECD countries, especially since the onset of the crisis, has steered the attention of academic analysis towards explaining its determinants. The trend of market income inequality is frequently analyzed to determine whether the evolution of disposable income inequality, after taxes and transfers, is more connected to the allocation of primary income or to the effects of redistributive policies. In fact, the OECD (2015) points out that during the recent weak economic recovery in developed economies, income inequality before taxes and benefits has continued to rise while the cushioning effect of taxes and benefits has become weaker, accelerating the overall upward trend in disposable income inequality. This result underlines the growing relevance of primary income inequality to explain changes in individual well-being.
In a previous study, the OECD (2012) highlighted that, before taxes and transfers, income dispersion mainly reflects labor market outcomes. For the working age population in the late 2000s, labor market income represents around 75% of the dispersion on average in the OECD, as compared with just 25% for self-employment and capital income combined. Most of the previous literature therefore relates such growing income dispersions to the functioning of labor markets, mainly due to increasing unemployment rates or growing wage dispersion (mostly the top versus the rest) and this has implied that the focus has been on labor earnings (also in gross and net income inequality), while capital and self-employment income have hardly been addressed.
With the important exception of Piketty and Saez (2014), non-labor market income, e.g. capital income and other sources of income, have hardly been considered relevant for explaining changes in market income inequality. Nevertheless, it is well known that capital gains, assets, property and wealth are much more unequally distributed than labor income in developed countries and their distribution has strong implications for individual well-being. In this context, we believe that it would be very interesting to complete the study of market income inequality considering the different flows of capital income to households at different positions of the income distribution curve. In fact, as Brun and Gonzalez (2017) show, owners of equity benefit from rises in value (due to monopolistic mark-ups) and from increasing equity returns, while households whose incomes rely on labor suffer from the decrease of the returns on human capital.
The aim of this study is to provide a detailed analysis of the weight of the different income sources divided into labor income and non-labor income in shaping market income inequality in Spain, one of the countries that experienced a larger GDP contraction during the recession and with a high percentage of home ownership. We pay attention to the measurement of the income value (as an approximation to well-being) accruing from ownership of a home and other assets. We base our calculations on Wolff et al.’s (2012) methodology for the US and calculate an imputed rent for the main owner-occupied housing net of mortgage debt. We also check the robustness of our results by computing the income generated by the household financial asset portfolio as a lifetime annuity.
We first analyze the evolution of our extended market income in contrast to the standard definition. In both cases, there was an important increase in market income from 2002 up to the financial crisis. Then, due the economic downturn, the level of the extended market income for 2014 fell to the levels of before 2005 and the standard market income was at the lowest level in the period of analysis. In Figure 1, it can be observed that the standard market income fell more sharply than the extended market income after 2008. The use of long term rates of return for computing the annuities of non-labor income could explain this difference.
If we consider the sources of our extended measure of market income (Figure 1), most remarkable is the downturn trend in labor and self-employment income especially after 2008, as a consequence of the deteriorating conditions in the labor market. In contrast, it highlights the enormous importance of real estate annuities, which in 2011 represented 23% of market income. However, it lost weight in 2014, and in absolute terms it fell to the levels seen before the financial crisis, due to decreasing house prices. However, it still preserves a significant weight in total income, because the fall in labor income was even sharper. Interestingly, the weight of the annuity from financial assets has grown more than 50% since 2002, representing around 7% of market income. These assets could be an alternative for the lower profitability of housing assets, revealing a change in the composition of household asset portfolios. Finally, the imputed rents have also gained importance since 2002 and accounted for 8% of market income in 2014. The main residence maintained its dominant influence on well-being in Spain despite the severe financial conditions after 2008.
Figure 1. Household equivalized market income in Spain, 2002-2014.
Source: Own construction using the Luxembourg Wealth Study (LWS) Database – Encuesta Financiera de las Familias (EFF),2002 to 2014.
Notes: Extended market income is the sum of labor income, self-employment, real estate annuities, financial annuities, and imputed rents. The financial assets also incorporate the income from private pensions and bonds. Standard market income includes the labor income, self-employment and capital income (property income plus realized capital gains).
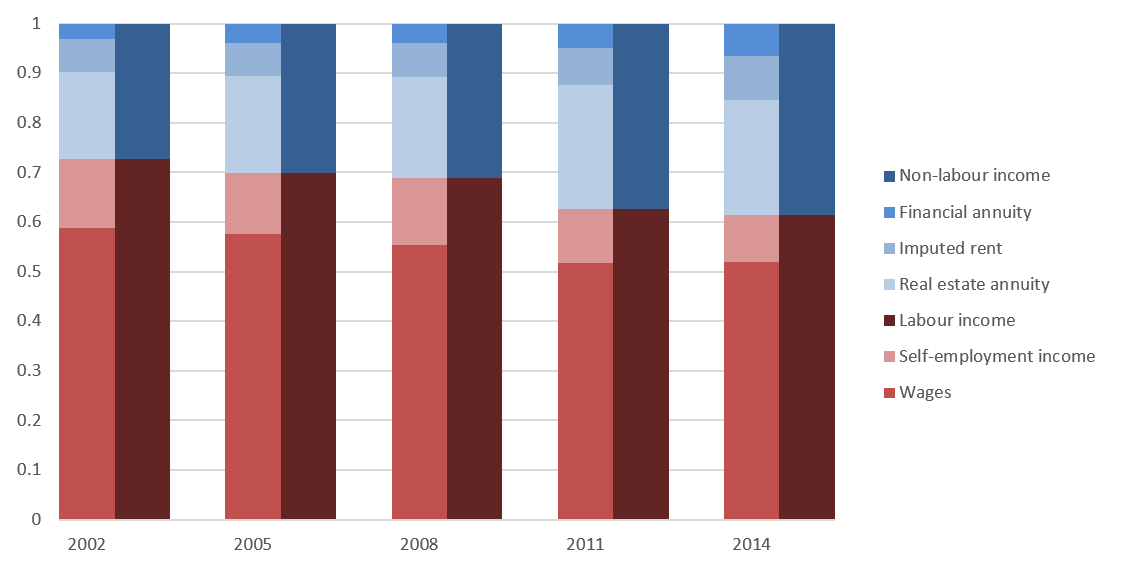
Figure 2 shows the increasing relevance of non-labor income in our extended measure of household well-being in recent years. While in 2002 non-labor income constituted 27 percent of total household extended income, in 2014 it had become more than 38 percent. This first result underlines the importance of considering other, non-labor market income flows to households when aiming to evaluate differences in household well-being and inequality trends. Indeed, labor income weight has fallen from 72% of market income in 2002, to 61% in 2014. This downturn was particularly important after the financial crisis, when the drop of this source of income was 11%. In contrast, non-labor income has gained relevance in both relative and in absolute terms.
Figure 2. Extended household equivalized labor and non-labor market income, 2002-2014.
Source: Own construction using the Luxembourg Wealth Study (LWS) Database – Encuesta Financiera de las Familias (EFF), 2002 to 2014.
To conclude, our extended income measure shows the continuous increase of non-labor income between 2002 and 2014. It is possible to transform the importance of real estate assets for the Spanish household wealth portfolio into a measurable source of well-being. The constant increase of imputed rents confirms the relevance of the main residence as a constant source of well-being in Spain. This growth has been steady even in the dramatic context of the real estate market after the financial crisis. Additionally, the extraordinary importance of the remaining real estate assets shows that they act as one of the main investments of Spanish households. However, due to the drastic drop in house prices their weight in our extended market income fell to levels lower than those in 2008. Therefore, Spanish households changed their wealth portfolio in favor of financial assets, which in 2014 represented 6% of our extended market income. We find that the drop of labor income as a result of the fall in employment and the deterioration of labor market conditions was partially offset until 2011 by the prominence of real estate annuities, the importance of imputed rents and the permanent increase in financial annuities.
References
| Brun, L., and González, I., (2017). “Tobin’s Q and Inequality.” SSRN. (https://ssrn.com/abstract=3069980). |
| OECD (2012). “Income inequality and growth: The role of taxes and transfers”, OECD Economics Department Policy Notes, No. 9. January 2012. |
| OECD (2015). “In It Together: Why Less Inequality Benefits All”. OECD Publishing, Paris, https://doi.org/10.1787/9789264235120-en. |
| Piketty, T and Saez, E. (2014). “Inequality in the long run.” Science, 344 (6186): 838-4. |
| Wolff, E. N., Zacharias, A., Masterson, T. (2012). “Trends in American living standards and inequality, 1959–2007”. Review of Income and Wealth, 58 (2): 197-232 |