Issue, No.10 (June 2019)
Modelling fiscal redistribution: A cautionary tale about the pitfalls of endogeneity
This article draws heavily on LIS Working Paper No. 762, “Can the structure of inequality explain fiscal redistribution? Revisiting the social affinity hypothesis” (February 2019), where detailed results can be found. The paper is in press at the Socio-Economic Review: https://doi.org/10.1093/ser/mwz005
If everyone was a rational actor simply maximizing their own income (and nothing else), the world would be an easy place to understand for policy-makers and researchers alike: we would only need to go back to our undergraduate text-books to know that higher levels of inequality are matched by greater fiscal redistribution. At least, this is what a simple model of taxes, transfers and the existence of utility-maximizing median-voters makes us believe (see Meltzer and Richard, 1981). However, as Branko Milanovic, based on joint work with Janet Gornick and Nathaniel Johnson, explained in the September 2018 edition of this newsletter, this is not how things are in reality (Gornick et al., 2017). Milanovic makes his case by comparing the United States and Germany but the argument could have been exemplified with many other pairings. In the United States, the two bottom quintiles start off with 11.7% of overall market income and gain relatively little when the effect of taxes and transfers is taken into account. By contrast, the poorest Germans receive 15.3% of all market income and then get a far bigger boost from progressive taxation and social transfers. So why do Americans fail to tax the rich in order to share the spoils, even though they have far bigger incentives to do so?
One could argue that America is different but if you are a political economist you prefer a general model that can explain it all. Lupu and Pontusson (2011) propose one that is particularly persuasive. They argue that “middle-income voters will empathize with the poor and support redistributive policies when the income distance between the middle and the poor is small relative to the income distance between the middle and the affluent” (ibid., p. 316). Drawing on the literature on racial and ethnic fragmentation (Luttmer, 2001) and the notion of perceived social distance, they develop a framework where – in the absence of crosscutting ethnic cleavages – income differentials are the source of social affinity between groups. Social affinity, in turn, shapes the allegiance of the middle class and hence the political coalitions that emerge in the distributional conflict (see also Kristov et al., 1992). In other words, Lupu and Pontusson suggest that a whole generation of political economists has been barking up the wrong tree when trying to establish a link between the level of inequality and redistribution – where what really matters is the structure of inequality.
Models, of course, are a dime a dozen. What makes a model influential is not only a compelling theory but also a set of empirical tests which show that a model’s predictions hold in the real world. In their paper, Lupu and Pontusson (2011) run some 30 regressions that consistently produce findings in line with their model, leading them to conclude that there is “robust evidence in support of the core hypotheses generated by this theory” (ibid., p. 332). Their primary outcome variable is fiscal redistribution, drawing on the Luxembourg Income Study (LIS) database and restricting observations to households headed by an individual aged 25–59 years. They corroborate their findings by using non-elderly social spending as an alternative dependent variable. For their main explanatory variable, they utilize OECD data on earnings differentials and derive a measure they call ‘skew’. Skew is the ratio of the upper decile ratio (D9/D5) over the lower decile ratio (D5/D1). Hence, values greater than unity indicate that the median wage is (in relative terms) closer to wages at the bottom than to those at the top, implying a greater likelihood of a pro-redistribution coalition.
The pitfalls of endogeneity: the earnings distribution and labour market institutions
A curious and generally overlooked aspect of the paper by Lupu and Pontusson is that it develops a theory that explicitly refers to the structure of income inequality, but then tests it against data that refer to earnings. While ‘earnings’ and ‘incomes’ are often used interchangeably, there are important differences between the two concepts: the OECD’s earnings data measures the distribution of labour incomes among individuals in full-time employment; income inequality captures the distribution of income from all sources among households, regardless of whether household members hold jobs or not. To make small and large households comparable, researchers usually adjust incomes for household size and then weight households by the number of its members. Although the dispersion of earnings should influence the distribution of household incomes, so do the distribution of capital income, the distribution of working hours and unemployment between individuals, and the sorting of high- and low-wage earners across households (Blau and Kahn, 2011, p. 179). In fact, as Salverda and Checchi (2015) have argued, the link is so complex that the “two strands of study, of wage dispersion on the one hand and household income distribution on the other, are miles apart” (ibid., p. 1537).
What may look like splitting hairs matters for the veracity of the social affinity model: The earnings distribution is heavily influenced by institutions and government interventions in the labour market. As Pontusson et al. (2002) show, union density, bargaining centralization and public sector employment all reduce earnings differentials. Importantly, they often have a much stronger effect on the D5/D1 ratio than on the D9/D5 ratio and hence give rise to skew. Earnings skew can therefore be best understood as an outcome of the welfare state – much like fiscal redistribution itself. In fact, it is entirely plausible that the same governments which set up labour market institutions to raise wages at the bottom also provide more generous social benefits and collect higher taxes from the well-off (see also Iversen and Soskice, 2009). While this might enthrall the beneficiaries of these policies, it is every econometrician’s nightmare: the central explanatory variable becomes endogenous, which makes results vulnerable to omitted variable bias.
To substantiate this line of reasoning, one has to show two things: First, labour market institutions and policies influence earnings skew; and second, the results change when controlling for this source of endogeneity. Taking stock of all the factors that explain the earnings distribution is the subject of a complex body of literature, but fortunately, in order to demonstrate endogeneity, it is sufficient to link a single policy instrument to earnings skew. Minimum wages are a self-evident example. Despite sharp disagreements over the damaging or beneficial effects of minimum wages, the arguments made on both sides of the divide imply that higher minimum wages should lead to greater skew. The first strand of the literature has focused on the wage effects of statutory minimum wages, by-and-large confirming that they achieve their stated objective and raise the wages of low-paid workers. The second major strand of the literature has concentrated on employment effects and (more controversially) claimed that minimum wages price workers with low productivity out of the market. Therefore, regardless of which position one takes, minimum wages should disproportionately increase the earnings at D1: either by lifting wages at the bottom, or by truncating the left tail of the earnings distribution.
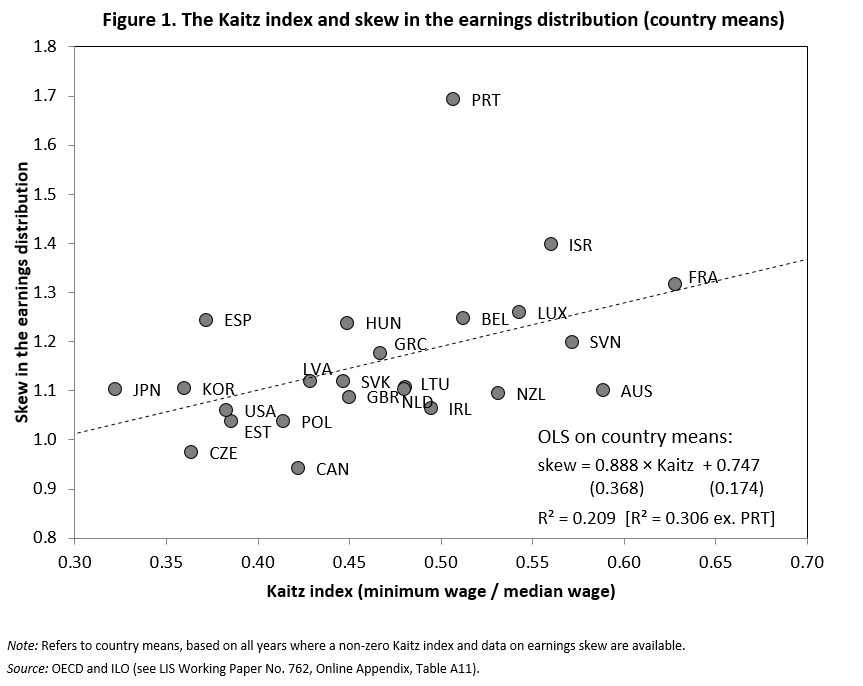
Figure 1 illustrates this point: countries with higher minimum wages typically also display a higher level of earnings skew (aside from the odd case of Portugal). A more complex regression model that makes use of the within-country variation of minimum wages supports the same finding, even when allowing that some countries (such as the Scandinavian countries and Austria) do not set minimum wages but have close functional equivalents in the form of comprehensive collective bargaining systems to set a floor for wages. There is also some indication that employment protection legislation (EPL) has similar effects and helps to raise the relative income position of low-paid workers. All of this lends credibility to the argument that earnings skew is not exogenous to welfare states but is itself at least in part a policy outcome.
Labour market regulation can of course not be reduced to minimum wages and EPL. Nonetheless, these policy areas provide two variables to test for omitted variable bias – the second step of the argument above. To their credit, Lupu and Pontusson make full replication materials available, so it is relatively easy to add these two variables to the models of the original paper. The results are not pretty: entering minimum wages as an additional control variable generally renders earnings skew – the key explanatory variable – insignificant. Granted, in a few models earnings skew remains a significant predictor for redistribution even when minimum wages are entered, but significance of the coefficients on skew vanishes when the EPL is also added. This supports the conclusion that the findings of the original paper were indeed driven by endogeneity – and that the explanatory variable, earnings skew, was not an appropriate choice to test the model.
Redistribution and between-group conflict
Beyond these econometric pitfalls, there is a theoretical argument to be made against using relative earnings differentials to explain redistribution. Doing so would imply conceptualizing redistribution as the product of distributional conflict within the group of wage earners. This is a counter-intuitive proposition as a key conflict that has shaped welfare states was the distributional conflict between labour and capital rather than within-group conflict among wage earners. But short of invoking class conflict, there is also the more pedestrian insight that many welfare states were designed to provide income support to those who are out of work (be it due to sickness, unemployment or old age). Hence, social transfers are largely financed by those who are currently employed (as well as through contributions by employers), whereas many of the benefits accrue to those out of work. While today’s wage earners might be tomorrow’s unemployed or leave the labour force altogether (and vice versa), it seems unwarranted to implicitly dismiss the potential for conflict between these two groups as irrelevant for redistribution preferences.
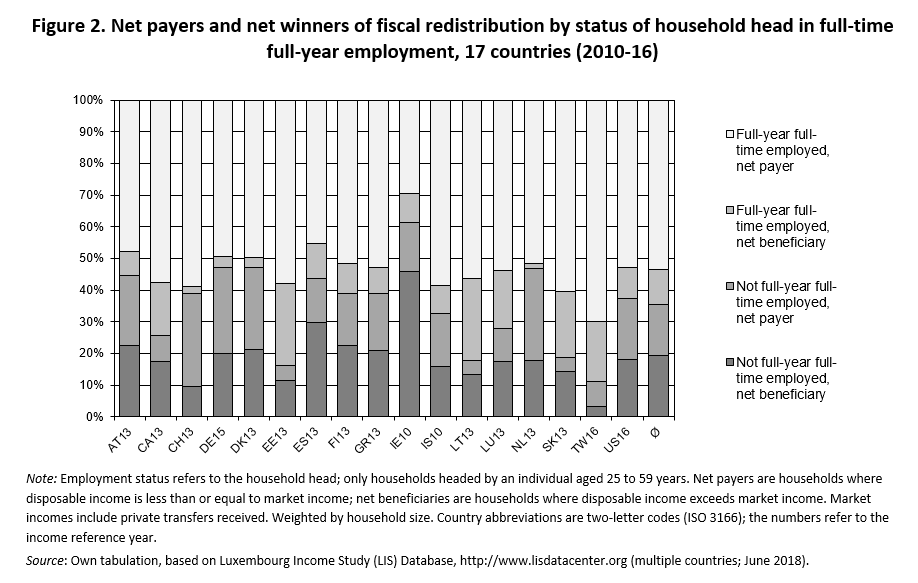
The proposition that between-group transfers matter can be put to an empirical test. Again, the Luxembourg Income Study (LIS) Database provides a reliable cross-national source. One conceptual complication is that the data measures employment status at the level of individuals but incomes at the level of households. Therefore, Figure 2 uses the employment status of the ‘household head’ to distinguish between households headed by somebody in full-year full-time employment (FYFT) and the remaining households, restricting observations to households with heads in the main working-age bracket. It then identifies households which are net payers and net beneficiaries from fiscal redistribution, according to whether disposable household incomes are lower (net payers) or higher (net beneficiaries) than market incomes. Despite this somewhat crude operationalization, the main finding is clear-cut: More than three-quarters of the net payers are found in households with a fully employed head, but almost two-thirds of the net beneficiaries live in households with a head who lacks full-year full-time employment. Moreover, the redistributive flows between groups are substantial: Averaging across all 17 countries, the tax and transfer system reduces the incomes of households with a head in FYFT by almost a quarter, whereas the remaining households are better off after taxes and transfers.
Testing theory against appropriate data: Does the structure of income inequality drive redistribution?
Econometric pitfalls and theoretical considerations alike therefore argue against testing the social affinity hypothesis on earnings data. After all, the theoretical model refers to the structure of income inequality, so why not assess it against data that, likewise, captures the structure of income inequality? Unfortunately, unlike in the case of the OECD’s earnings data, quantile thresholds for household market incomes are not readily available in tabulated form (for disposable incomes, see the database by Gornick and her collaborators or the data compiled by Thewissen, Nolan and Roser). Thus, to calculate a skew measure that follows the one developed by Lupu and Pontusson, one needs to access micro-data (read: LIS micro-data). However, because those at the 10th percentile often have zero market incomes, the poor are better defined as those at the 25th percentile and, equivalently, the affluent as those at the 75th percentile. This allows calculating income skew as the ratio of the upper and lower quartile ratios, or as (P75/P50)/(P50/P25).
Given the expansion of the LIS database in recent years, this yields an impressive 192 country-years from developed countries alone (data are supplied in the replication data-set). Using LIS as a source has the additional advantage that the main explanatory variable and the outcome variable are now, by construction, available for the same countries and years, solving the need to extrapolate and interpolate data. Both variables are based on a consistent set of definitions and, by virtue of access to the micro-data, can be restricted to the same reference population (in this case, households with a head in the main working-age group). And while the micro-data allow researchers to make choices regarding technical details such as the equivalence scale, the quasi-convention (followed in the paper) is to use “standard LIS routine” and to divide household incomes by the square root of the number of household members.
Equipped with a treasure trove of LIS data (plus a bag full of control variables), hypothesis testing can begin (see Luebker, 2019, for details). Recall that, according to the theory, more skew should lead to more redistribution. However, the data stubbornly refuses to yield anything like a positive relationship: coefficients on skew are either insignificant or negative and significant, i.e. carry the ‘wrong’ sign. This holds irrespective of model specification. Findings do not change either when only observations prior to 2008 are used, when skew in disposable incomes is used as the explanatory variable, and when switching to social spending as the outcome variable. In short, there is no support for the social affinity hypothesis when it is tested against data on skew in the income distribution.
Time to bid farewell to a seductive theory?
In sum, the original results that lend support to the social affinity hypothesis do not hold when tested on a different, theoretically more appropriate data-set. This sends a note of caution for researchers working on income distribution: best to make sure that your data matches your theoretical concept as closely as possible. While earnings data are valuable in their own right, they should not be used as a rough-and-ready substitute for data on incomes. It is therefore worthwhile to pay attention to the (admittedly sometimes complex) definitional details of different income concepts (as detailed in the Canberra group handbook). And where tabulated data-sets are missing, it is worth the extra effort to work with the remote access to LIS micro-data (an exercise that is less challenging than it might seem to new users, given the excellent LIS self-teaching manuals).
Regarding theory, it seems that the political redistribution is still more complex than thought but that ever more sophisticated redistribution models are not necessarily the answer. Sophistication sometimes comes at the expense of realistic micro-foundations. Under the structure of inequality logic, for instance, voters are not only expected to judge their own position in the income distribution accurately but also that of others. Further, they have to assess relative income distances and make these the basis for their stance on redistribution. This is a demanding standard. As the OECD points out, “[m]ost of us have no idea – or the wrong idea – of how we compare with the rest of the population”1. A series of recent survey experiments has demonstrated that people have indeed great difficulty in assessing their own income position, so it is much less likely that they can make accurate judgements about relative income differentials – as opposed to a general assessment of the level of inequality in the society that they live in.
1 See “Compare your income” at http://www.oecd.org/statistics/compare-your-income.htm (accessed on 21 April 2017).
References
| Blau, F. D., and Kahn, L. M. (2009) ‘Inequality and earnings distribution’. In Salverda, W., Nolan, B. and Smeeding, T. M. (eds) Oxford Handbook of Economic Inequality, Oxford, Oxford University Press, pp. 177-203. |
| Gornick, J. C., Milanovic, B. and Johnson, N. (2017). American Exceptionalism in Market Income Inequality: An Analysis Based on Microdata from the Luxembourg Income Study (LIS) Database. LIS Working Paper Series No. 692. Luxembourg: LIS. |
| Iversen, T. and Soskice, D. (2009) ‘Distribution and Redistribution: The Shadow of the Nineteenth Century’, World Politics, 61, 438–486 |
| Kristov, L., Lindert, P. H. and McClelland, R. (1992) ‘Pressure Groups and Redistribution’, Journal of Public Economics, 48, 135–63. |
| Luebker, M. (2019) Can the structure of inequality explain fiscal redistribution? Revisiting the social affinity hypothesis. LIS Working Paper Series No. 762. Luxembourg: LIS. |
| Lupu, N. and Pontusson, J. (2011) ‘The structure of inequality and the politics of redistribution’, American Political Science Review, 105, 316–36. |
| Luttmer, E. F. P (2001) ‘Group loyalty and the taste for redistribution’, Journal of Political Economy, 109, 500–28. |
| Meltzer, A. H. and Richard, S. F. (1981) ‘A rational theory of the size of government’, Journal of Political Economy, 89, 914–27. |
| Pontusson, J., Rueda, D. and Way, C. R. (2002) ‘Comparative Political Economy of Wage Distribution: The Role of Partisanship and Labour Market Institutions’, British Journal of Political Science, 32, 281–308. |