Issue, No.8 (December 2018)
The new Russian data from PIS in LIS – a glance at income and poverty
In this quarter (Winter 2018), LIS has released five new data points for Russia into the LIS Database: ru11, ru13, ru14, ru15, and ru16. The datasets are based on the Survey of Population Income and Participation in Social Programs (PIS) carried out by Rosstat1.
In 2012, Rosstat began the PIS survey in order to improve capture and produce more reliable income and poverty indicators (for the following in more detail see United Nations, 2017). Prior to PIS, Rosstat used a methodological approach of 1) empirical data collected through household budgets sample surveys (HBS), and 2) an analytical model, with the application of HBS results and macroeconomic indicators. However, some concerns were raised with respect to this approach: First, variance in poverty estimates obtained through the two sources created a lack of coherence in the poverty rates for the entire population and when decomposed according to different socio-demographic characteristics. Second, as the HBS focused on expenditure and consumption data, information on income remained underestimated. To carefully address these issues, the PIS survey mainly focuses on the collection of different income components, and the availability of social support and social services. Sample coverage of the survey was enlarged gradually from 10,000 households in 2012 (ru11) to 60,000 in 2016 (ru15), and 160,000 in 2017 (ru16). In addition, the PIS closely follows the European Survey of Income and Living Conditions (SILC) methodology in income aggregation, while also being consistent with the ILO Resolution on Household Income and Expenditure (2013). In 2013, and the years following, estimates obtained through PIS showed higher correlation and convergence with macroeconomic indicators compared to HBS, 88% vis-à-vis 70% on average.
In this article, we explore key findings concerning poverty, inequality, and disposable income trends from the newly added data points. For all three measures, we use disposable household income, equivalised by the LIS scale (household income divided by the square root of household members). After describing the observed trends in the data, we will discuss these trends further in the subsequent section.
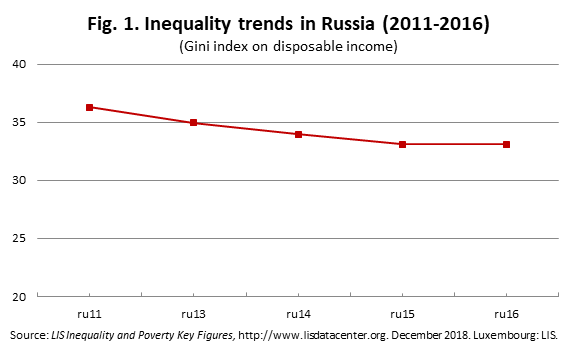
According to the collected data, inequality trends in Russia from 2011 to 2016 (Fig.1) suggest that, while inequality is persistently moderately high, with a Gini coefficient above 0.3, it has declined from around 0.36 in 2011 to 0.33 in 2016, a 3 percentage points decrease, while it has stagnated in recent years. As noted by the World Bank (2018a), these figures should be interpreted with caution, as top income earners were not well captured, which could bias the estimates downward.
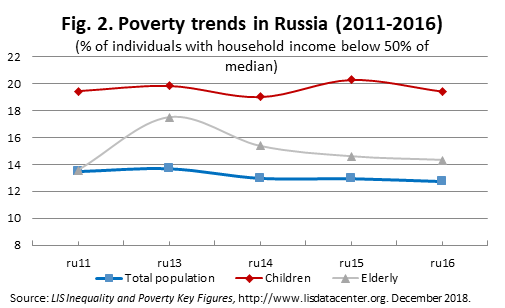
For the same years, we also look at poverty rates (at 50% below the median) for different groups: total population, children, and elderly (Fig. 2). The highest poverty rate (around 19%) can be observed among children, the most vulnerable group. Child poverty is among the highest in the developed and ex-Soviet Union countries2. While overall poverty showed a minor decrease (0.7 percentage point) over the surveyed period, elderly poverty showed an opposite pattern, registering a slight increase from 13.5% to 14.3% (with a significant increase of 4 percentage points in 2013).
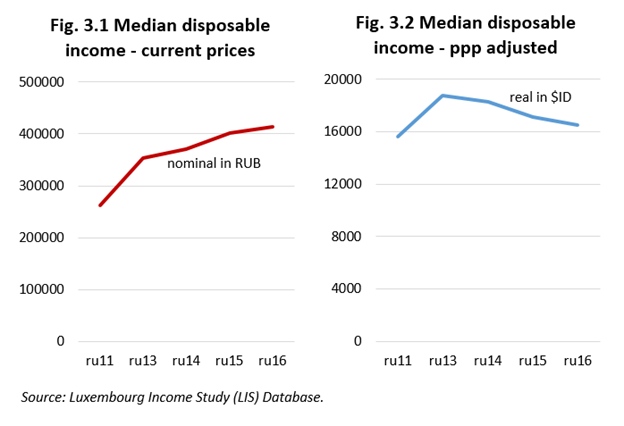
In what follows, we will present numbers for nominal vs. real income trends over the period of 2011-2016. Figures 3.1 and 3.2 plot the development of median equivalised income in nominal vs. real terms. Fig. 3.1 reveals that nominal disposable household income in Russian Rubles almost doubled during the period, while a closer look at the same income measure in real terms (Fig 3.2, ppp-adjusted using International US Dollar)3 shows a significant downward trend, with a decrease in equivalised disposable income from 18,773 in 2013 to 16,521 in 2016. The data clearly supports the view that the period was characterised by an economic boom followed by a recession. The drop in real disposable income reflects the recent recession that followed the 2014 financial crisis, triggered by a serious devaluation of the Russian Ruble and high inflation rates.
This scenario, combined with pro-rich income taxation policies (flat rate at 13%) with no wealth tax (Russell, 2018), and shrinking self-employment incomes, as small business activities are contracted (World Bank, 2018b), resulted in comparatively high poverty rates throughout the whole period 2011-2016. According to official Russian statistics, poverty increased to 20 million Russians in 2016 (Russell, 2018).
Where does this leave inequality? It would be natural to expect growing inequality when poverty gets more acute. Russell (2018) seeks to explain this paradox with employer strategies during the crisis. Rather than lay-offs, Russian employers focused on wage cuts, which in turn affected employees across the whole income distribution. We encourage LIS microdata users to explore this interesting pattern further.
In conclusion, we see that inequality and poverty in Russia remain some of the most pressing topics and that they require an implementation of additional pro-poor policies, a better-developed state redistribution system possibly combined with a higher tax rate for the wealthy, and particularly raised (price-adjusted) social benefits that keep up with inflation targeted at poor families and children.
1 For LIS users, please note that the data of ru13 from the RLMS survey has been replaced by the PIS survey. For those interested in accessing the old survey data point, please contact us. The old data points of ru00, ru04, ru07, and ru10 from the RLMS survey have been revised and are still part of the LIS database and accessible through the LISSY system.
2 LIS provides child poverty rates among its key figures for all the available countries/years through its search engine tool.
3 LIS provides ppp deflators through this link.
References
| Russell, M. (2018). Socioeconomic inequality in Russia, European Parliamentary Research Service, accessible here |
| United Nations (2017). Development of methodology in the field of measuring inequality and poverty in transition to new sources of information: Experiences and problems, Note by the Federal State Statistics Service of the Russian Federation (Rosstat), Economic Commission for Europe, ECE/CES/2017/33, Conference of European Statisticians, Sixty-fifth plenary session, Geneva, 19-21 June 2017, accessible here. |
| World Bank (2018b). Poverty & Equity Brief, Europe & Central Asia, Russian Federation, World Bank, April 2018, accessible here. |
| World Bank (2018a). Poverty & Equity Brief, Europe & Central Asia, Russian Federation, World Bank, October 2018, accessible here. |