Issue, No.7 (September 2018)
Income redistribution across different income groups across OECD countries
Disclaimer: The views expressed here are those of the authors and do not necessarily reflect those of the institutions they represent.
Many OECD countries have been facing a prolonged period of low growth and stagnating income of the poorest. While the extent, timing and characteristics of rising inequalities vary across countries, one common feature is rising wage dispersion and in a number of countries increasing job polarisation. This challenges governments’ fiscal redistribution, all the more so in a context where new forms of work are calling into question the effectiveness of traditional social safety nets and population ageing is putting pressure on public finances. Yet tax and transfer systems are fundamental pillars of an inclusive growth policy agenda that aims at sharing the benefits of growth more equally and securing decent living standards for those in most need.
In order to deliver evidence-based analysis on redistribution, we need to first document and take stock of the extent to which tax and transfer systems mitigate market income inequality today, and how this has changed over a period of rising globalisation, technological change and pressure from population ageing. This is what we achieve in a recent paper (Causa and Hermansen, 2018) by delivering a comprehensive assessment of income redistribution to the working-age population, covering OECD countries over the last two decades1. Redistribution is quantified as the relative reduction in market income inequality achieved by personal income taxes, employees’ social security contributions and cash transfers, based on household-level micro data from the OECD and the LIS.
Taxes and transfers reduce market income inequality by slightly more than 25 per cent on average across the OECD; yet this average figure masks a great deal of heterogeneity ranging from 40 per cent in Ireland to around 5 per cent in Chile. The level of redistribution is also highly variable in countries exhibiting similar levels of market income inequality: for example, market income inequality stands at around 38 Gini points in both Japan and Norway, but disposable income inequality stands at around 27 points in Norway compared to 32 points in Japan.
Since the mid-1990s, the redistributive effect of taxes and transfers has declined, on average and in the majority of OECD countries for which data are available. The trend towards less redistribution was most pronounced over the pre-crisis period (1995-2007), and was temporarily reversed during the first period of the crisis (2007-2010), reflecting the cushioning impact of automatic stabilisers and fiscal discretionary measures. Trends in redistribution were more heterogeneous over the most recent decade, with increases in around half of OECD countries, in particular those hardest hit by the crisis.
How different income groups are affected by observed levels and changes in redistribution is a question of considerable policy relevance that cannot be properly captured by relying on the Gini coefficient which is known to be relatively less sensitive to changes occurring at the tails of the distribution. One way to shed light on this issue is to calculate relative changes in income shares accruing to different income groups before and after taxes and transfers, analogous to the redistribution measure based on the Gini coefficient. For the purpose of this analysis, households are grouped in high (last quintile), low (first quintile) and middle (middle three quintiles) income households. For example, in Denmark 2.7% of total market income earned by the working-age population accrued to the bottom quintile in 2013, while 9.6% of total disposable income accrued to the bottom quintile, hence the difference due to redistribution by taxes and transfers is equal to 7 percentage points. For the middle quintiles, this difference is equal to 0.2 percentage points. Conversely, redistribution by taxes and transfers tends to reduce the share of income accruing to the top quintile so this difference is negative, equal to -7.2 percentage points in Denmark. By construction, the differences in income shares across the considered groups sum to zero. This analysis is relatively crude and simplistic yet informative of the different patterns of redistribution across OECD countries, in particular as regards the differential treatment of the middle class (Figure 1):
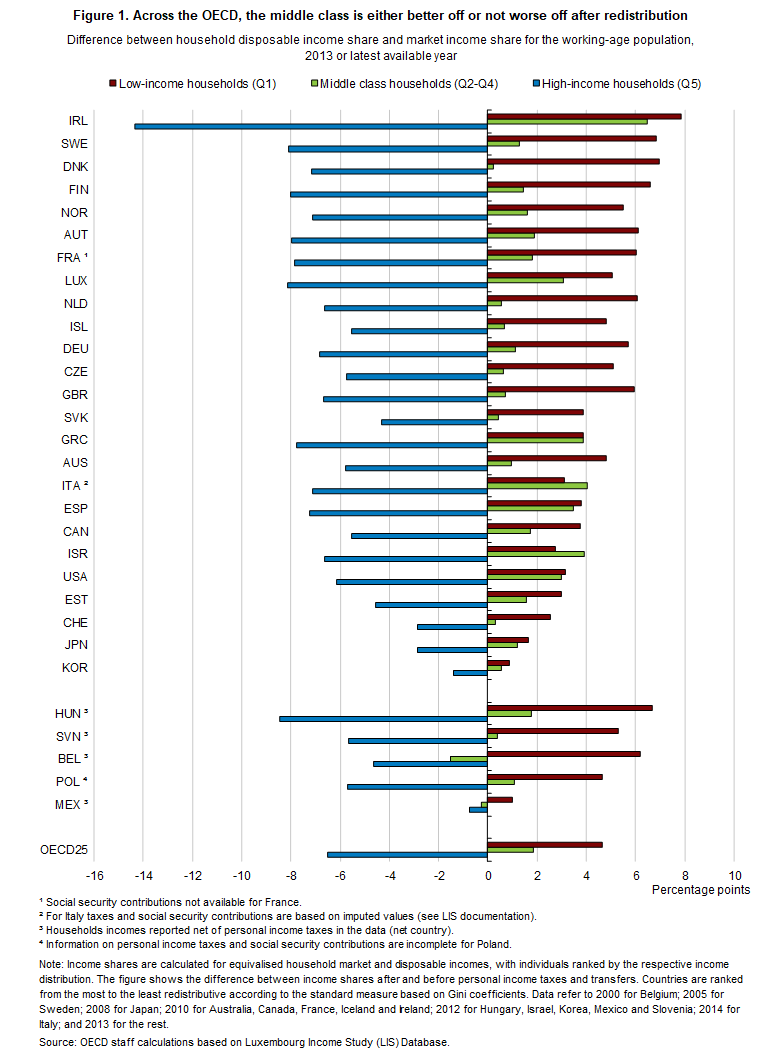
Figure 1 supports that in most OECD countries the middle class is better off after redistribution through taxes and transfers as the change in its income share is positive and substantial. However, departures from the average are sizeable:
- In a few countries, middle class households tend to gain in equal proportion or more from redistribution than low income households. This only happens among relatively low redistributive countries such as Israel, the United States and Italy, as well as Greece and Spain.
- In most countries, middle class households tend to gain from redistribution but less so than low income households. This applies to most redistributive countries such as Ireland but also least redistributive ones such as Japan.
In a number of OECD countries, the middle class is neither better nor worse off after redistribution through taxes and transfers as the change in its income share is close to zero. In such cases, the change in the income share accruing to high and low-income households tend to roughly offset each other. This pattern is observed both in high-redistribution countries such as Denmark, where the rise in the income share accruing to low-income households and the corresponding decline in the income share accruing to high-income households is relatively important; as well as in low-redistribution countries such Switzerland, where the rise in the income share accruing to low-income households and the corresponding decline in the income share accruing to high-income households are relatively limited.
Tracking changes in pre-post redistribution income shares for low, middle and high-income households over the last two decades allows for a better understanding and qualification of the broad redistribution trends documented in the previous section. For the purpose of this exercise, households in the three middle quintiles are from here on treated separately as lower-middle class, middle class and higher-middle class (Figure 2). The following insights emerge:
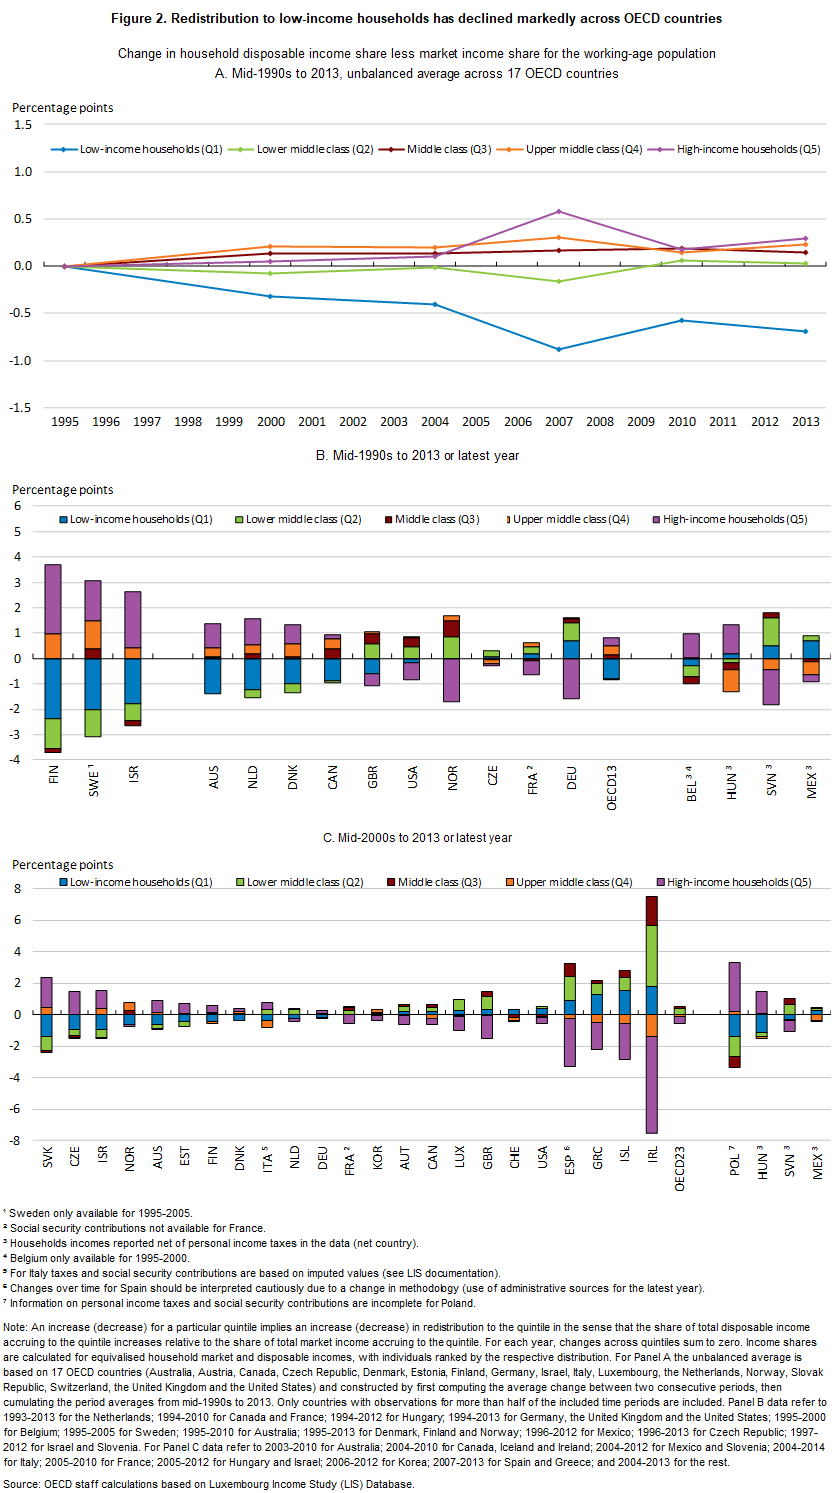
- Low-income households, that is, the bottom 20 per cent, have lost the most from changes in redistribution over the last two decades: the change in income share pre and post-tax transfers has been declining on average and among most OECD countries. Households in the second quintile have been also losing from redistribution in a number of countries, although comparatively much less than those in the first quintile so that on average the change in their income share has not evolved over the last two decades. The decline in redistribution towards low-income households took place essentially between the mid-1990s and the onset of the crisis: during the first phase of the crisis the decline reversed, as observed for overall redistribution, a reflection of the cushioning effect of automatic stabilisers and temporary income support measures.
- Upper-middle class and high-income households, that is, the top 40 per cent, have gained the most from changes in redistribution: the change in income share pre and post-tax transfers accruing to the top 40 per cent has been increasing on average across the OECD and in a majority of OECD countries (for this group, the change means a less negative difference between the income share based on market and disposable income, respectively). This pattern was most pronounced between the mid-2000s and the onset of the crisis; it temporarily stopped during the first phase of the crisis.
- Middle class households, that is, those between the top and bottom 40 per cent, have been little affected from changes in redistribution, on average and in the vast majority of OECD countries.
Overall, this analysis shows that in many OECD countries the bottom 20 per cent, hence poor households (based on a relative poverty criterion) have been the primary losers from the decline in redistribution through the last two decades. However, this broad picture does not equally apply to all countries and in all periods. In particular, it does not apply to Greece, Ireland, Spain and Portugal over the latest decade, a likely reflection of the strong and sustained increase in unemployment which implied rising measured redistribution to low-income groups. It also reflects strong policy reactions to limit income hardship and rising poverty in the first stage of the crisis through various cash-transfers schemes. Again, an exception to this is Italy where, despite the prolonged labour market crisis, all households except the top 20 per cent have been losing from changes in redistribution and poor households have been losing the most.
One underlying policy issue is that designing well-targeted transfers towards low-income groups is challenging. This reflects various obstacles associated with means- or income-testing such as considerable non-take up and high administration costs, but also that targeted transfers can be distortive by creating low-income traps. In our study (Causa and Hermansen, 2018) we provide some evidence on the interplay between different combinations of average transfer rates — that is the size of the transfer system — and the degree of targeting of the transfer system. In short, this evidence suggests that observed transfer rates are in many OECD countries too low for targeting to have a major impact. By design, targeted transfers are smaller in size than e.g. insurance transfers or universal transfers, so that their impact on overall inequality is limited in most countries. Still, such transfers play a key role in ensuring income adequacy among vulnerable groups and securing minimum living standards.
From a broader perspective and to conclude, tax and transfer reforms should be designed within an array of complementary policy instruments to address equity and efficiency objectives, taking into account country-specific context, constraints and social preferences. For example, well-designed “springboard” packages should combine tax and transfer policies to make work pay and boost jobs with policies to improve employability, skill adaptability and wage prospects. In other words, to raise job quality for less-skilled and at-risk individuals such as disadvantaged youth and immigrants, but also for older workers facing displacement in declining sectors.
1 Relevant work in this area include Immervoll and Richardson (2011); OECD (2008, 2011, 2015); Joumard et al. (2012); Lindert (2017).
References
| Causa, O. and M. Hermansen (2018), “Income redistribution through taxes and transfers across OECD countries” , LIS working paper No. 729. |
| Immervoll, H. and L. Richardson (2011), “Redistribution Policy and Inequality Reduction in OECD Countries: What Has Changed in Two Decades?”, OECD Social, Employment and Migration Working Papers, No. 122, OECD Publishing, Paris. |
| Joumard, I., M. Pisu and D. Bloch (2012), “Tackling Income Inequality: The Role of Taxes and Transfers”, OECD Journal: Economic Studies, Vol. 2012/1. |
| Lindert, P. H. (2017), “The Rise and Future of Progressive Redistribution”, Commitment to Equity (CEQ) Institute Working Paper 73, Tulane University. |
| OECD (2008), Growing Unequal? Income Distribution and Poverty in OECD countries, OECD Publishing, Paris. |
| OECD (2011), Divided We Stand: Why Inequality Keeps Rising, OECD Publishing, Paris. |
| OECD (2015), In It Together: Why Less Inequality Benefits All, OECD Publishing, Paris. |