Issue, No.6 (June 2018)
Comparing top incomes between survey and tax data: US case study
There are two main sources of microdata used to measure income – data based on household surveys and data from fiscal sources (specifically tax data). Both sources capture the distribution of income, but there are substantial differences between them. While the share of the population that report their income to fiscal authorities is high (in the US in 2013, 90% of the population filed taxes; see Figure 1), fiscal data are collected by tax authorities, and hence vary with tax codes both within countries over time, and across countries. On the other hand, surveys are based on samples of the population, which creates a potential for differences in income, compared with the tax source, at the top of the distribution. However, survey income is more stable over time and is defined according to international conventions and is thus more comparable across countries. In addition, survey income concepts are broader, not restricted by tax codes, and survey data have the advantage that they are available in highly disaggregated form (that is, they include many more categories of income). One benefit of this flexibility is that it allows us to use survey data to construct income definitions that match those in the available fiscal data, and to assess where the differences between the two sources lie.
In this study, we do exactly this. We compare income in the top income decile between survey data and tax data. We use the Luxembourg Income Study (LIS) Database for the survey data and the World Wealth and Income Database (WID) for the tax data. We break the top decile into three income groups – the top 1% (p99p100), the next 4% (p96p99), and the bottom 5% (p91p95). Within each group, we disaggregate income into three sources – labor, business, and capital income. The purpose of our study is twofold: first, to understand at what point the difference in income between the two sources begins (whether at the 90th, 95th or 99th percentile); and second, to assess the source and magnitude of this difference. We present preliminary results for the US case below.
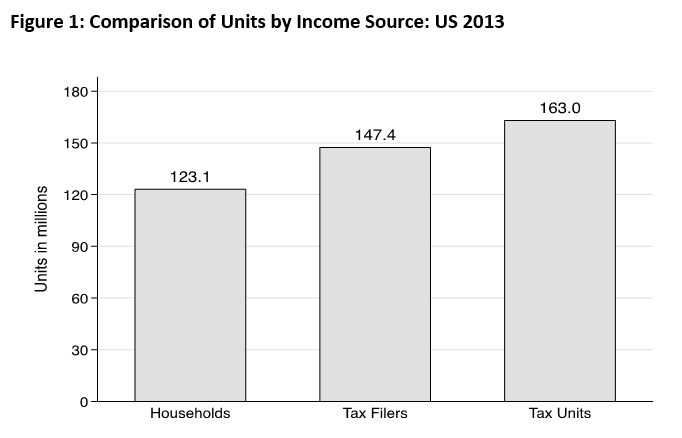
The primary unit of analysis in household surveys is the household. The unit of analysis in fiscal data depends on the national tax code. For example, tax units in the US are composed of couples and singles and their dependents, while, in the UK, all the tax filing units are individuals. Figure 1 shows the total number of household units, tax filers, and tax units for the US in 2013. Tax filers are units that file taxes1. The non-filers are added to the tax filers to get to total tax units. In 2013, there were 25% fewer household units compared to tax units2.
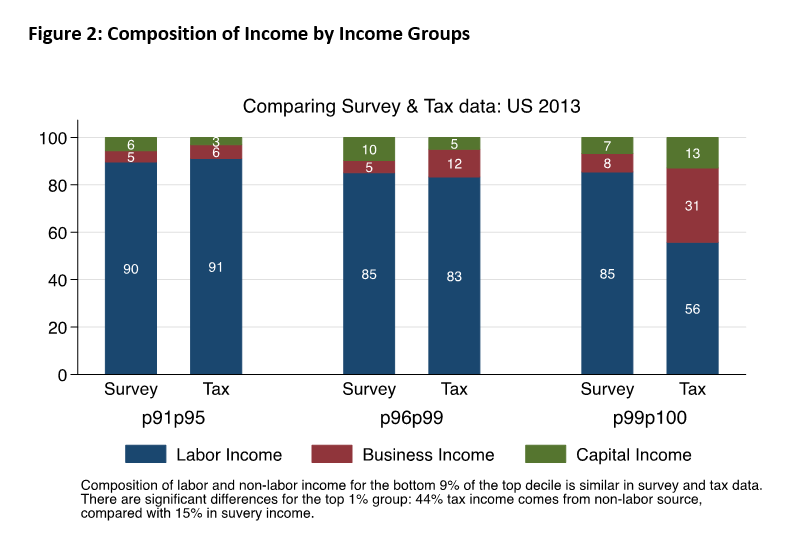
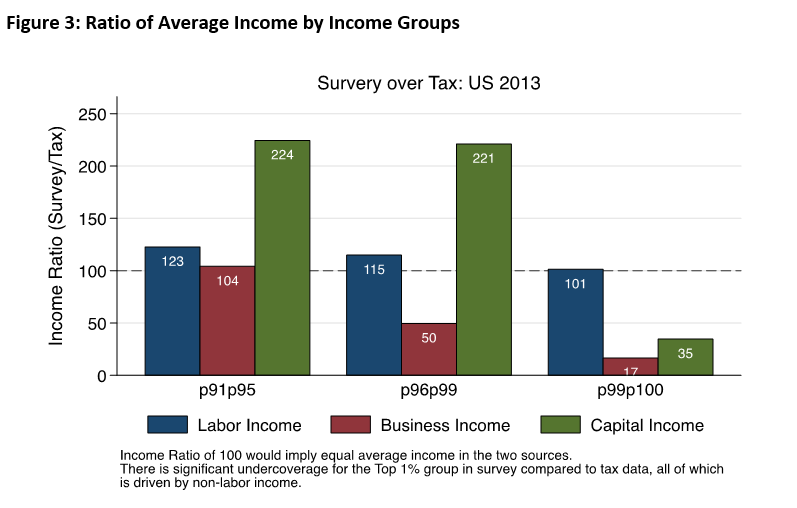
Figure 2 compares the composition of total income between these survey and tax data. While the composition of the top 1% is substantially different between the two data sources, the composition of labor and non-labor income within the two lower groups are similar. Within the top 1% in the tax data, 44% of the income comes from non-labor source compared to only 15% in the survey data. Figure 3 compares the average income of the three groups by income source. As with the composition reported in Figure 2, survey mean non-labor incomes are substantially less than the tax mean non-labor income for the very top percentile. Mean labor income, on the other hand, is roughly equal across the income groups, and mean capital income is over-reported in the p91p95 and p96p99 groups.
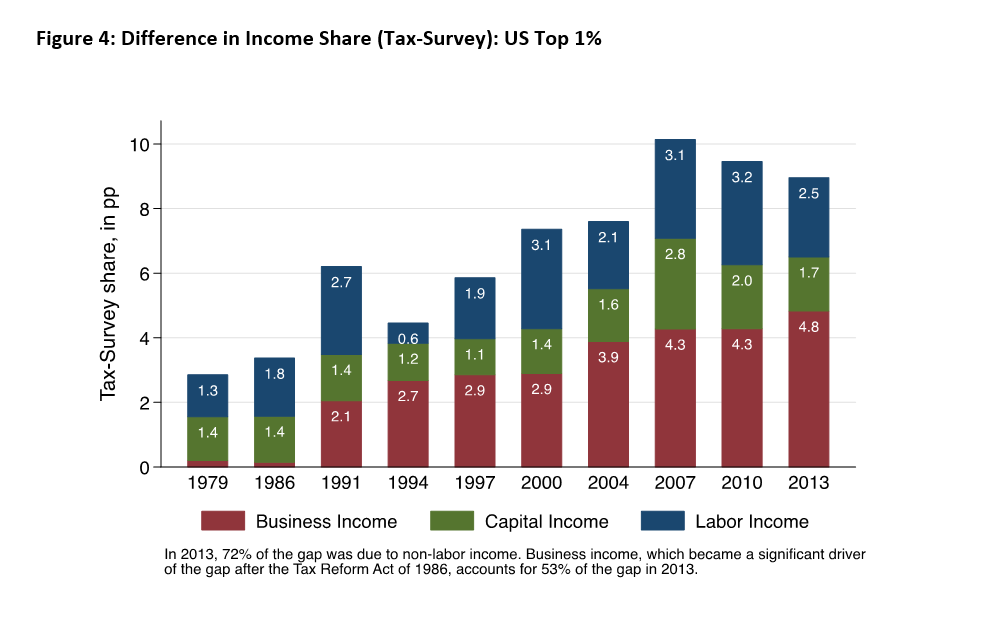
We have thus far seen that there is substantial difference of income only within the very top percentile, and almost all of this is driven by the non-labor portion of income. Figure 4 presents the percentage point gap, within the top 1%, between income shares from tax versus survey data. Two things stand out: first, there is an increase over time in this gap in the US, and second, non-labor income plays a substantial role in this increase. In 2013, 72% of the gap is explained by non-labor income. Within the non-labor income, it is business income that explains most of the difference. Its reporting on tax forms has increased following the US Tax Reform Act of 1986; business income alone accounts for 53% of the gap between the two sources in 20133.
1 Not all tax units file taxes. In the US, the fraction of tax units filing taxes (or tax filers) were, on average, 94% in the post-World War II period (Atkinson and Lakner, 2017).
2 There are generally fewer total households than total tax units because there are typically more than one tax unit within a household. We find that the number of total household units are on average 80% of total tax units.
3 S-corporation filing status became more attractive following the US Tax Reform Act of 1986, which reduced the top personal tax rate to below the corporate tax rate (Slemrod, 1996).
References
| Atkinson, A., & Lakner, C. (2017). Capital and labor: the factor income composition of top incomes in the United States, 1962-2006. |
| Atkinson, A. B., Piketty, T., & Saez, E. (2011). Top incomes in the long run of history. Journal of economic literature, 49(1), 3-71. |
| LIS (2018). LIS Database. Retrieved from /our-data/lis-database/ |
| Slemrod, J. (1996). High-income families and the tax changes of the 1980s: the anatomy of behavioral response. In Empirical foundations of household taxation (pp. 169-192). University of Chicago Press. |