Issue, No.6 (June 2018)
A new step in the understanding of extreme inequality dynamics: Chile comes with 12 waves 1990- 2015
This June, Chile is a new country in LIS: this new case will be particularly helpful for understanding extreme inequalities. Even if Chile is not alone in the group of high Gini indices – South Africa, Columbia and other Latin American countries may be more radical in extreme inequality – we, for the first time, can now observe a long trajectory, with 12 waves spread across a time span of 25 years 1990-2015: this means a time span twice longer than South Africa or other extreme countries like Brazil, Guatemala or Uruguay.
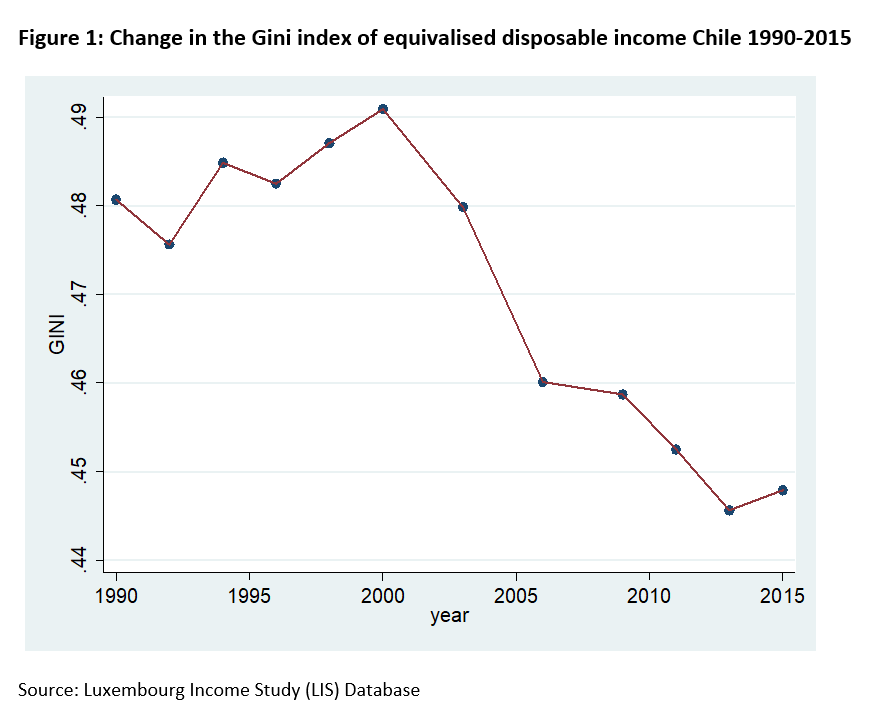
With its traumatic history during the Pinochet regime (1973–1990), that redesigned the social structure in an extreme model of inequality, and then a process of recovery of democracy. The first analysis shows a rapid, steady process of income equalization after the 2000s, when the Gini index of the “level of living” (disposable income per consumption unit) was close to .50. Under the presidency of center left Ricardo Lagos (2000-2006) and then Michelle Bachelet (2006-2010), the intensity of inequality dropped by almost 5 points in a decade, a not common trait in LIS countries.
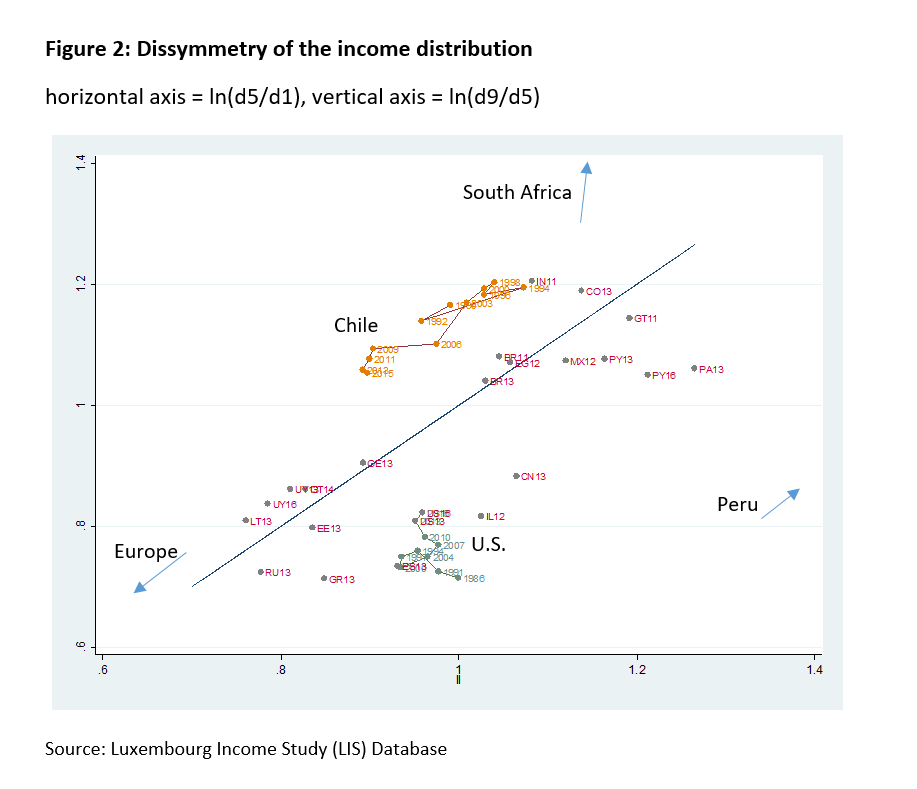
Chile is interesting for its trends, but also for a not so usual structure of distribution. In many LIS countries we observe a relative equality of the top decile to median ratio d9/d5, and the median to lower decile ratio d5/d1. This means a general symmetry of the histogram of the logged income. When we look closer to the more than 300 Lis datasets (as of June 2018, 335 datasets), we find that in 72% of the cases (d9/d5) is smaller than (d5/d1). In the majority of countries, we observe a dissymmetry from the median where the poor go deeper in poverty than the rich climb to the top of affluence. This means in the majority of countries, the limitation in richness (e. g. through progressive income tax) is relatively stronger than reduction of poverty (e. g. through social redistribution). The U.S. distribution is a strong example of this feature where relative poverty can reach extreme levels. Chile is an opposite case and represents in this respect an exception: the poorer are not so far below the median (given the intensity of inequality in Chile) but the rich diverge far away above the median at an exceptional magnitude. This fits with the general impression of visitors to Chile who consider relative social homogeneity at the bottom of the Chilean society and extreme income affluence at the top. This means also a new lower middle class is developing with very specific traits.
This contributes to explain why Chile, with a much higher Gini index than the U.S. (.45 in Chile, .38 in the U.S.) the Chilean relative poverty rate (60% of the median) is below the American one (23.2% in CL15 compared to 24.2% in US16). This is due to the fact that the Gini is more sensitive to inequalities at the top, and evidently less so to poverty and inequalities at the bottom. This is why the inclusion of Chile in LIS might help understand better how societies might experience rapid changes in the intensity and shape of inequality: Chile could be more than an additional country but an important clue in the politics and inequality nexus.
References
| Contreras, Dante and French-Davis, Ricardo, 2012, “Policy regimes, inequality, poverty and growth: The Chilean experience, 1973 – 2010” WIDER Working Paper 2012/04. |
| Vicente Espinoza, Emmanuelle Barozet, María Luisa Méndez, 2013, Estratificación y movilidad social bajo un modelo neoliberal: El caso de Chile, Revista Lavboratorio , 14(25), 169-191. |