Issue, No.5 (March 2018)
Long-term trends in real income growth and inequality in Germany and the United States
A recent report on wage inequality in Germany by Grabka and Schröder (2018) emphasised on the long-term development of real hourly wages and annual wages. The authors argue that despite of the positive developments on the labour market, accompanied by increasing force participation rates and low unemployment, real hourly gross wages have hardly increased. On the contrary, the strong increases in employment in the low-wage sector led to a substantial drop in real hourly wages in the first decile far below the level of the early 1990s. Only in recent years, measures to reduce dependency on social transfers, while being employed, seem to have caused a turning point to substantially increase real hourly wages between 2013 and 2015. The picture was even more critical for real annual earnings, where wage dispersion massively grew throughout the period 1991 to 2015. Real wages for the first two deciles dropped to 60 % as compared to the 1991 situation, the middle deciles remained at around the same level, and wages in the top decile increased to 120 % (Grabka and Schröder, 2018).
This article aims to shed further light on in how far these fairly strong increases in inequality among dependent workers can be analogously concluded for inequality among the total society. In order to do so, the analyses are extended in two ways. First, all observations were kept in the sample, hence, real income growth and inequality was estimated for the total society. And second, the German situation is compared against long-term income growth and inequality trends in the United States to put into perspective the magnitude of inequality evolution. The underlying data use two of the longest data series in the LIS Database. For Germany, I selected the same data DE91-DE15 as Grabka and Schröder (2018) from the GSOEP v33 release by DIW (updated in March 2018 for all years available in LIS, in line with this latest version v33). For the United States, I used the LIS datasets from the CPS – ASEC data, restricting the analyses likewise to US91-US16.
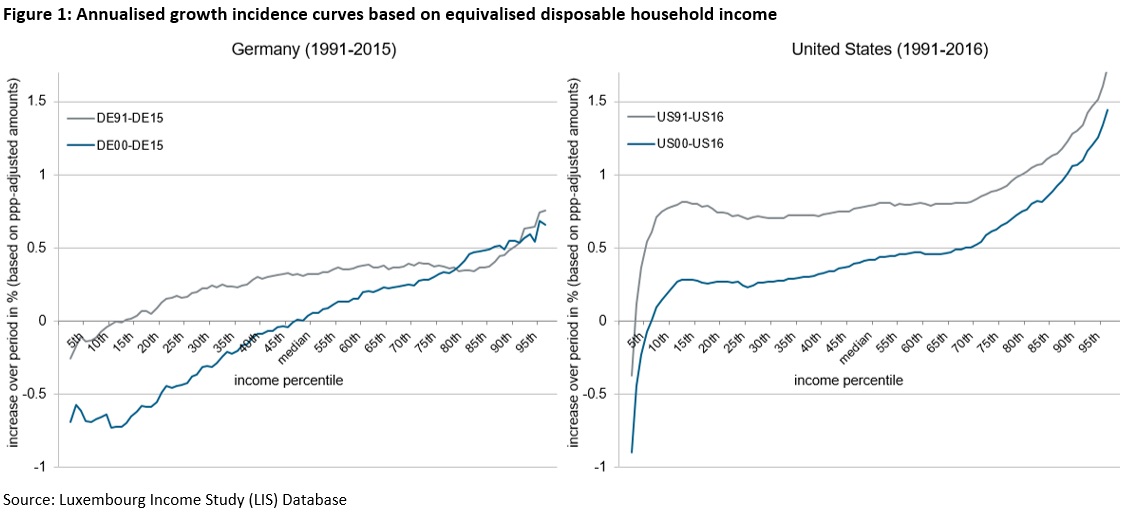
Figure 1 presents a comprehensive view on income growth among the total society. The calculated numbers are commonly referred to as Growth Incidence Curve (GIC) (for example by the LAC Equity Lab by the World Bank), which capture annualised growth rates for each percentile of the income distribution between two points in time. The presented numbers here refer to equivalised disposable household income (DHI), which divides DHI by the square root of household members in order to account for economies of scale in the household. The annualised growth rates refer to real incomes after adjusting for inflation and ppp-conversion to 2011 international dollars. Two calculations are contrasted against each other, the long-term trend from 1991 to 2015/16 and the more recent trend from 2000 to 2015/16.
First of all, Figure 1 shows that annualised real income growth has not been substantial throughout the period from 1991-2015/16 in both countries, particularly, when looking at the more recent period from 2000 to 2015/16, growth remained far below the growth rates over the longer period. Median income in the United States grew by 0.79 % p. a. from 1991 to 2016 and by 0.42 % p. a. from 2000 to 2016, whereas in Germany median income grew much less from 1991 to 2015 (0.32 % p. a.), and showed almost no increase at all from 2000 to 2015 (0.03 % p. a.). It is worth mentioning that strong increases in real income growth in the latest years heavily moved the curve US00-US16 upwards; when looking at the curve US00-US13, the curve showed negative growth even up the 60th percentile, data available upon request.
When looking specifically at the negative growth rates, a remarkable difference between the countries could be observed. As nicely illustrated by a recent article by Leonhardt (2017) in the New York times, negative income growth has shifted strongly to be concentrated among the poorest poor of the income distribution. The lowest income deciles in the United States have seen the highest income growth rates in the 1980s and 1990s (in Figure 1 still mirrored by the peak at the 14th income percentile over the period 1991 to 2016), but since the 2000s, income growth turned to be lowest among the low income group as compared to the higher income groups. In Germany, real income growth for the low income deciles has already been low in the 1990s. Given the findings by Grabka and Schröder, who found sharp decreases of real annualised earnings for a large part of the wage earners, this is not surprising as such. However, remarkable is the magnitude of negative real income growth for almost half of the population from 2000 to 2015. Besides limited growth in real wages, data analyses on German retirees suggest that real income growth might be additionally hampered due to no longer increasing pension incomes for younger pensioner cohorts as a result of major cuts in the pension system in the 1990s (Neugschwender, 2016).
When looking at the upper end of the income distribution, it becomes apparent that the highest income percentiles have seen the highest increases. However, the shape of the curves is notably different. In Germany, although the highest percentiles have seen the highest increases, the slope is rather low and linearly increasing by income percentile, whereas in the United States, starting from the 70th percentile, the growth curve reveals an exponential shape, thus highly increasing inequalities among the three upper income deciles.
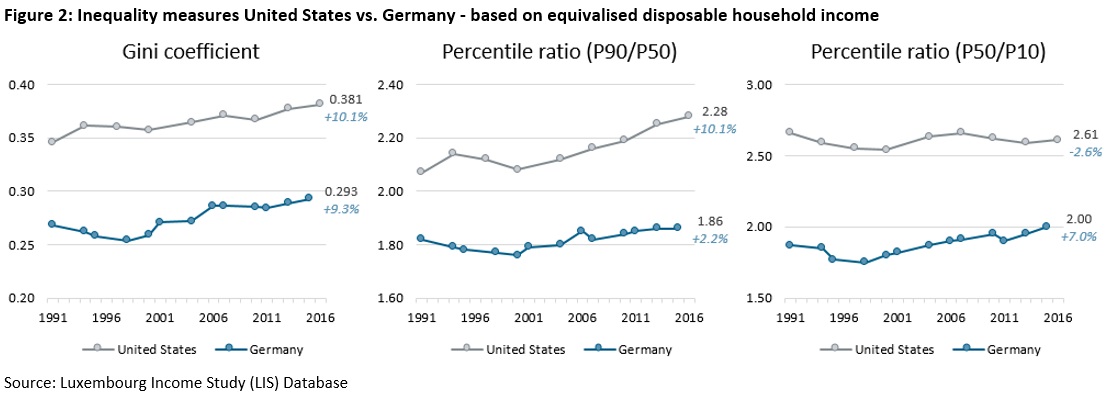
Figure 2 puts in context the rather concerning numbers for Germany. On all three inequality indicators, Gini coefficient and percentile ratios p90/p10 and p50/p10, the United States indicates substantially higher levels of inequality. In the United States, the thresholds at the lowest decile (p10) and the highest decile (p90) are much further away from the median equivalised DHI. With an increase of 10.1% from 1991 to 2016 it is particularly the percentile ratio p90/p10 which strongly grew in the United States, the meagre increase of 2.2 % in Germany from 1991 to 2015 seems almost negligible with respect to this. On the other hand, for the same period, in Germany a rather solid increase of 7 % for the percentile ratio p50/p10 could be observed. Keeping in mind that this increase is associated with a negative growth of real incomes, it is particularly alarming. But also the unchanged magnitude of 2.6 times higher median equivalised DHI than the p10 in the United States might remain a cause for concern with respect to a highly unequal society.
In conclusion, possible policy actions to smoothen inequality increasing trends seem rather obvious. On the one hand, there could be better policies fostering social inclusion, e.g. via minimum wage legislation, but also via accessible social assistance benefits, accompanied with reasonably high amounts preventing poverty. Additional active labour market measures might ease labour market entry and guide persons through periods of job transition. On the other hand, higher taxation for the high income earners and property income could limit income growth for the high income group.
References
| Grabka, M. M. and Schröder, C. (2018). Inequality in Germany: decrease in gap for gross hourly wages since 2014, but monthly and annual wages remain on plateau, DIW Weekly Report, Issue 9/2018. |
| Leonhardt, D. (2017, Aug. 7). “Our Broken Economy, in One Simple Chart”, The New York Times, https://www.nytimes.com/interactive/2017/08/07/opinion/leonhardt-income-inequality.html, accessed on 7 March, 2018. |
| Neugschwender, J. (2016). Pension Systems and Income Inequality among the Elderly in Europe, Mannheim [Dissertation], https://ub-madoc.bib.uni-mannheim.de/41262/. |