Issue, No.4 (December 2017)
Children, Poverty, and Public Policy1
Child poverty raises widespread concern. While poverty is viewed as problematic throughout the life cycle – it affects children, prime-age adults, and the elderly – children’s poverty is especially worrisome. Child poverty compels attention for multiple reasons: it is widely accepted that children deserve protection from hardship; most children have little or no influence over their economic circumstances; deprivation during childhood can have lifelong consequences; and some effects of child poverty spill over, influencing schools, neighborhoods, and the health of communities. Many argue that child poverty in rich countries is particularly unacceptable, because it is shaped less by scarce national resources and more by the public and private institutions that distribute resources. Most countries tackle child poverty using a package of policy approaches, with policies targeted on families included as a powerful component. Over the last thirty years, a large literature on child poverty has emerged, much of it based on cross-national microdata produced by LIS, the cross-national data center in Luxembourg.
The issue of child poverty has attracted the attention of many scholars using the LIS microdata. Over the last 30 years, nearly 100 LIS Working Papers have assessed child poverty outcomes; in many of these papers, child poverty is the central concern. These studies are diverse with respect to conceptual frameworks, poverty measures, countries included, years covered, and content. Several focus on cross-national variation in within-country poverty determinants; many identify and decompose the drivers of cross-national variation. (For a detailed review of this literature, see Gornick and Jäntti 2012.) Two comprehensive LIS-based studies – a 2003 book (on poverty levels) by Rainwater and Smeeding, and a 2008 journal article (on poverty trends) by Chen and Corak – influenced the empirical work reported here. In both studies, the core questions focus on explanations for cross-country variation in child poverty outcomes.
Rainwater and Smeeding consolidated and updated their earlier research on child poverty, in their 2003 book Poor Kids in a Rich Country: America’s Children in Comparative Perspective. The book includes several lines of inquiry: cross-national variation in child poverty rates, effects of population characteristics on poverty, and the role of different income sources in mitigating child poverty in both one- and two-parent families. A primary focus in their work, which includes fifteen rich countries, is the role that household demography plays in explaining variability in child poverty rates, where demography includes household composition by gender, age, and size, and the earning status of the head, spouse, and other household adults. Focused on the exceptionally high U.S. child poverty rates, they concluded that demography is not destiny: the demographic composition of the U.S. contributes to its higher child poverty with respect to only half of their study countries and, in most of those cases, its contribution is modest.
Chen and Corak, in a 2008 Demography article, “Child Poverty and Changes in Child Poverty”, assessed trends during the 1990s in 12 high-income countries. They reach three main conclusions. First, demographic shifts played a fairly minor role in explaining child poverty trends throughout the 1990s (partly because demographic factors evolve slowly). Second, changes in employment and earnings mattered much more. Third, income transfer policy reforms aimed at raising employment rates have inconsistent effects on families’ income, post-tax-and-transfer. Social policy reforms interact, in complicated ways, with other factors, including the overall level of child poverty, the magnitude and functioning of the service and other sectors, and the overall hospitability of the labor market to low-skilled and other disadvantaged workers. Chen and Corak close with a cautionary note: “There is no single road to lower child poverty rates. The conduct of social policy needs to be thought through in conjunction with the nature of labor markets (Chen and Corak, 2008, p.552).” Thus, like Rainwater and Smeeding (2003), Chen and Corak find that, when accounting for variation across countries in child poverty, demographic variation matters modestly; national labor market patterns and social policy designs matter a great deal.
Gornick and Nell (2017) recently assessed the state of child poverty in 24 LIS countries, using datasets from LIS’ Wave 8, centered on year 2010. Our study countries include 19 high-income countries – five Anglophone countries (Australia, Canada, Ireland, United Kingdom, United States), four Continental European countries (France, Germany, Luxembourg, Netherlands), three Eastern European countries (Estonia, Poland, Slovak Republic), four Nordic countries (Denmark, Finland, Iceland, Norway), and three Southern European countries (Greece, Italy, Spain) – and five middle-income countries, all in Latin America (Brazil, Colombia, Panama, Peru, Uruguay). (As we will explain, in Figure 2 we include only the Anglophone, Continental, Eastern European, and Nordic countries).
We begin with a general question: To what extent, and how, do child poverty rates vary across these 24 high- and middle-income countries? We ask that question, first, using a common approach in comparative research – that is, defining poverty in a relative framework, specifically with the poverty line set at 50 percent of each country’s median equivalized income. Using this approach, we base poverty rates on what households have “at their disposal”, that is, household income after state-provided taxes and transfers are taken into account.
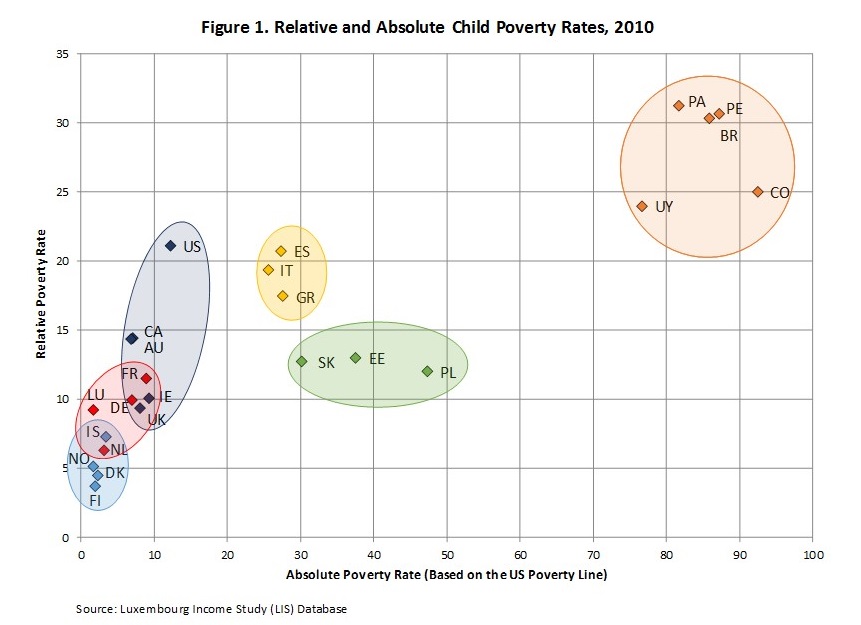
Our results indicate that children’s poverty rates (defined as the percentage of children living in households with equivalized income less than 50% of the national household median) vary dramatically across these 24 study countries – ranging from over 30 percent in Brazil, Panama, and Peru down to 5 percent or less in Denmark and Finland (see Figure 1, vertical axis). We also see that patterns vary across clusters. The highest poverty rates are seen in the Latin American countries (cluster average, 28 percent), followed by the Southern European (19 percent) and Anglophone (14 percent) clusters. Lower poverty rates are seen, on average, in the Eastern European (12 percent), Continental European (9 percent) and Nordic (5 percent) countries. Clearly, national contexts matter.2
Poverty lines matter: poor compared to whom?
What about poverty with respect to a fixed real income poverty line, often called absolute poverty? Does the cross-national portrait of child poverty change when we consider not just poverty relative to one’s own country, but poverty with respect to a common standard-of-living threshold that is applied to all 24 countries?
To assess this, we use U.S. children as an illustration – in two ways. One, we use the official U.S. poverty line to establish a threshold to be drawn across all 24 countries, and, two, we consider how child poverty in the U.S., specifically, stacks up in the two comparative frameworks.
When we use the relative poverty framework, the child poverty rate in the U.S. is 21 percent, the sixth highest among these 24 countries; child poverty is higher only in the five Latin American countries. When we shift to the absolute poverty framework, the results shift (see Figure 1, horizontal axis). The U.S. rate falls to 12 percent, ranked eleventh among these 24 countries; now child poverty is higher in all of the Eastern and Southern European countries as well as in the Latin American countries. These results should not surprise us, given that all of these countries are less affluent (GDP/capita is lower) than the U.S. But what is surprising is that U.S. absolute poverty remains high among a core group of rich comparator countries. U.S. poverty, using the U.S. line, exceeds that reported in the other Anglophone countries, as well as in all of the Continental and Nordic cases – and most of these comparator countries are less affluent than the U.S. In cross-national terms, U.S. child poverty stands out – and that is true for both relative poverty and absolute poverty.
Two conclusions stand out from Figure 1. One, poverty definitions matter. Comparative child poverty results differ sharply between the two analytic frameworks. These results highlight the importance of considering absolute poverty comparisons when studying countries with widely divergent standards of living.
Second, some clear patterns emerge: Latin American children are clearly the most likely to be poor, both relatively and absolutely. Nordic children (along with children in the Netherlands) are the least likely to be poor, again, in both frameworks. Child poverty rates in the other clusters fall in between. Children in the Anglophone countries, on the whole, are about as likely to be relatively poor as are children in Southern and Eastern Europe, although they are notably less likely to live in absolute poverty.
Poverty and Redistribution in 16 High-Income Countries
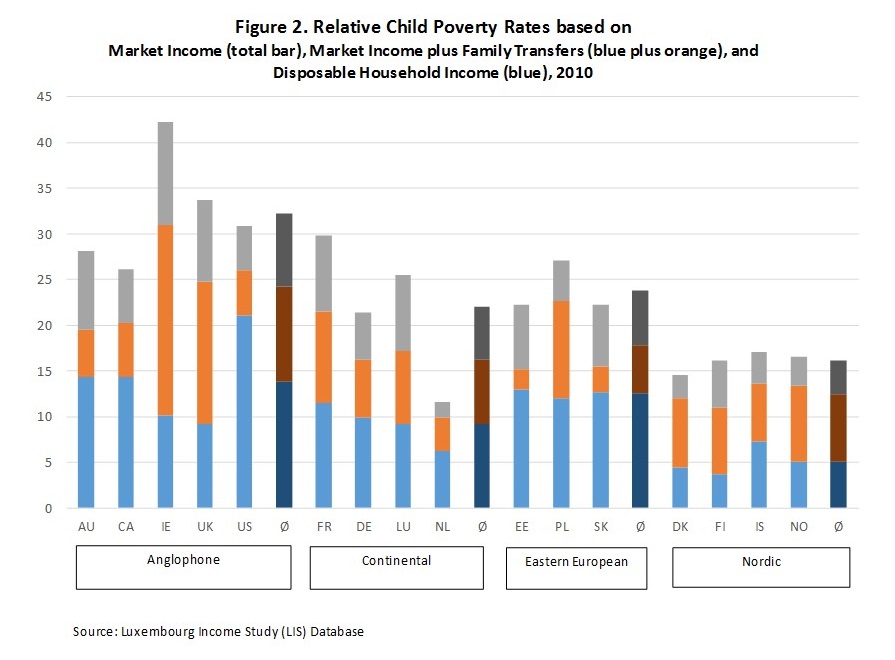
What role does the state play in reducing the risk of child poverty? In Figure 2, we report the results of an analysis using a simple accounting framework to shed light on redistribution. (Due to data limitations that restrict identifying family transfers precisely, we include only a subset of 16 countries in Figure 2). We report poverty rates (with the line set at 50 percent of median equivalized disposable household income) based on market income alone (see the total length of the bars), and on market income plus family-related transfers (see the sum of the blue and orange segments)3. Finally, we report child poverty rates based on disposable household income – which is income from the market and family transfers, plus other transfers, net of taxes paid (see the blue segments).
Several results stand out.
First, family transfers – i.e., transfers from maternity/paternity/parental leave schemes, and from universal and means-tested transfers targeted on families – matter for children’s poverty. In the Anglophone countries, they remove nearly 8 percentage points of market-generated poverty – reducing the average (country-level) poverty rate in this cluster from 32 to 24 percent. In the Continental and Eastern European countries, family transfers remove about 6 percentage points of poverty – and, in the Nordic countries (where the market-driven poverty rate is the lowest), about 4 points.
Second, other transfers (e.g., unemployment, disability, survivors) – even net of taxes paid – reduce children’s poverty further. Clearly, taxes and transfers, as a whole, serve to reduce children’s poverty everywhere – on average, by 18 points in the Anglophone countries, and 11 to 13 points in the other clusters.
Third, the share of total poverty reduction (from taxes and transfers) due to family transfers is substantial – but family transfers, overall, are not associated with the majority of poverty reduction. The amount of poverty-reduction associated with family transfers ranges from over three-quarters in Estonia to about one-quarter in Denmark. On average, across these sixteen countries, the average share of poverty reduction due to family transfers is 45 percent – or just less than half. It is crucial to note that these results must be taken as approximate. In the LIS data, it is not possible to render this variable (“IATFAM”) identical in every country; in some cases, some components of these family-related income sources cannot be isolated as they are combined, in the microdata, with other income sources – sometimes wages, sometimes other transfers. Nevertheless, we conclude, the overall finding holds: about half of all child poverty reduction, associated with tax/benefit systems, is due to these family transfers.
One two-country comparison is especially useful. In the UK, the child poverty rate, based on market income, is 34 percent, slightly higher than in the U.S., where it is 31 percent. However, the magnitude of redistribution in the two countries is substantially different – with 25 percentage points of poverty “removed” by taxes and transfers in the UK (over a third of that from family transfers), compared with 10 in the U.S (half from family transfers). The result? Disposable income poverty – that is, poverty after taxes and transfers – is considerably lower in the UK, at 9 percent – compared to 21 percent in the U.S.
Conclusion
First, child poverty rates clearly vary dramatically across the countries included in our empirical work. Variation in child poverty is evident with respect to both market- and disposable-income poverty. Cross-national variation in children’s poverty risk is especially compelling when we consider absolute (or “real-income”) poverty. In relative poverty terms, child poverty rates vary from 4 percent in Finland to 31 percent in Panama and Peru, whereas, in absolute terms, child poverty ranges from 2 percent in Luxembourg, Norway, and Finland to over 90 percent in Colombia. Clearly, where children reside markedly affects their likelihood of living in poverty.
Second, governments use a variety of instruments to alleviate market-driven poverty among families with children. One set of tools includes transfers targeted on families and/or children – i.e., leave schemes, universal allowances, and targeted family transfers. These are crucial for poverty reduction but they are not the whole story anywhere. We conclude that – in general, across 16 affluent countries included in this component of our analyses – about half of poverty reduction attributed to tax/benefit systems is achieved via these family transfers. Other, more generalized income supports are as crucial for reducing child poverty – and, in several countries, more so.
Finally, our results support a conclusion reached by many contributors to the cross-national literature on children’s poverty: keeping child poverty, especially relative poverty, at comparatively low levels is potentially achievable through government interventions. However, many countries fail to strenuously tackle children’s poverty. That failure cannot be explained by the absence of policy options; it is best explained by a lack of collective political will.
1 This newsletter entry is based on LIS Working Paper 701, “Children, Poverty, and Public Policy: A Cross-National Perspective”, co-authored with Emily Nell. A version of LIS WP 701 is forthcoming as Chapter 13, “Children, Poverty, and Public Policy: A Cross-National Perspective” in The Handbook on Child and Family Policy, edited by Guðný Björk Eydal and Tine Rostgaard, Edward Elgar.
2 Figure 1 contains 24 countries; due to data limitations, Figure 2 contains a subset of 16 countries. In these figures, the abbreviations are as follows: Australia (AU), Brazil (BR), Canada (CA), Colombia (CO), Denmark (DK), Estonia (EE), Finland (FI), France (FR), Germany (DE), Greece (GR), Iceland (IS), Ireland (IR), Italy (IT), Luxembourg (LU), Netherlands (NL), Norway (NO), Panama (PA), Peru (PE), Poland (PL), Slovak Republic (SK), Spain (ES), United Kingdom (UK), United States (US), Uruguay (UY).
3 To estimate the effects of family-related policies, we use a variable – “family/children transfers” (“IATFAM”, created by LIS and available in the LIS Database) – which includes (as available): (i) short-term work-related cash transfers from maternity, paternity, or parental leave insurance schemes, (ii) family-related cash transfers from public programs which are universal in structure, and (iii) family-related cash transfers that are targeted on individuals or households in need.
References
| Chen, W.-H. and Corak, M. (2008), Child Poverty and Changes in Child Poverty, Demography, 45 (3), 537–553. |
| Gornick, J. C., and Jäntti, M. (2012), Child Poverty in Cross-National Perspective: Lessons from the Luxembourg Income Study, Children and Youth Services Review, 34, 558–568. |
| Gornick, J. C., and Jäntti, M. (2010), Women, Poverty, and Social Policy Regimes: A Cross-National Analysis, in P. Saunders and R. Sainsbury (eds), Social Security, Poverty and Social Exclusion in Rich and Poorer Countries, International Studies on Social Security – Volume 16, Antwerp: Intersentia, pp. 63-95. |
| Gornick, J. C., and Jäntti, M. (2009), Child Poverty in Upper-Income Countries: Lessons from the Luxembourg Income Study, in S. B. Kamerman, S. Phipps and A. Ben-Arieh (eds), From Child Welfare to Child Wellbeing: An International Perspective on Knowledge in the Service of Making Policy, New York: Springer Publishing Company, pp. 339-368. |
| Gornick, J. C., and Nell, E. (2017), Children, Poverty, and Public Policy: A Cross-National Perspective, LIS Working Paper No. 701. Luxembourg: LIS; forthcoming as Chapter 13, “Children, Poverty, and Public Policy: A Cross-National Perspective” in The Handbook on Child and Family Policy, edited by Guðný Björk Eydal and Tine Rostgaard, Edward Elgar. |
| Nell, E., Evans, M., and Gornick, J. C. (2016), Child Poverty in Middle-Income Countries, LIS Working Paper No. 666. Luxembourg: LIS. |
| Rainwater, L., and Smeeding, T. (2003), Poor Kids in a Rich Country: America’s Children in Comparative Perspective. New York: Russell Sage Foundation. |