Issue, No.3 (September 2017)
Old-age Poverty in South Korea
A recent Guardian article attracted broad attention to an extremely high old-age poverty rate in Korea. Titled, “South Korea’s inequality paradox: long life, good health and poverty”, it raised a puzzle how a country with the longest life expectancy finds itself with nearly half (48.6 percent) its older citizens living in poverty. As a preliminary step to unravel this puzzle, I reviewed the data referred by the Guardian and examined the Korean elderly poverty using the LIS data.
The Guardian used the OECD data for elderly poverty rates and the data from the Longevity Study at Imperial College London for life expectancy. The latter estimates that Korean females born in 2030 will have the longest life expectancy in the world. However, the choice of life expectancy measure seems to reflect the author’s intention to frame the elderly poverty issue more paradoxically. A better measure for life expectancy is that of the current elderly population rather than that of the future generation. According to the OECD data, the life expectancy of the Korean elderly (at age 65 in 2011) is not the longest. Korea ranked at the 14th longest for females (86.5 years) and the 25th for males (82.1 years) among 35 OECD countries (OECD, 2017). Though not the highest, it is still high. For females, the life expectancy is slightly longer than that of Sweden (86.3 years).
Independent of Korea’s rank in terms life expectancy, it is still puzzling how a rich democracy can sustain such a high elderly poverty rate. To begin with, I checked the possibility of overestimation. To measure elderly poverty rates, it is conventional to transform household incomes into personal incomes of each household member (OECD, 2015). In this process, the economy of scale is taken into account by using an equivalence scale. Consider Household A with 2 adults and 2 children having a monthly income of 40,000 USD and Household B with 1 elderly having a monthly income of 10,000 USD. Using the OECD equivalence scale (square root scale), each member in Household A will not be assigned 10,000 USD (40,000/4), but 20,000 USD ( 40,000/ (4(household size))^(1/2) ). And for a member in Household B, the equivalized income is the same 10,000 USD ( 10,000/(1^(1/2)) ). This is based on the assumption that each member’s utility will increase by sharing goods and services. And for a member in Household B, the equivalized income is the same 10,000 USD (10,000/v1). This is based on the assumption that each member’s utility will increase by sharing goods and services. This process makes the poverty rate of the elderly higher (and that of children lower) than it is without (Föster, 1994). This is because the equivalized measure inflates the median income (and the poverty threshold defined as 50% of the median).
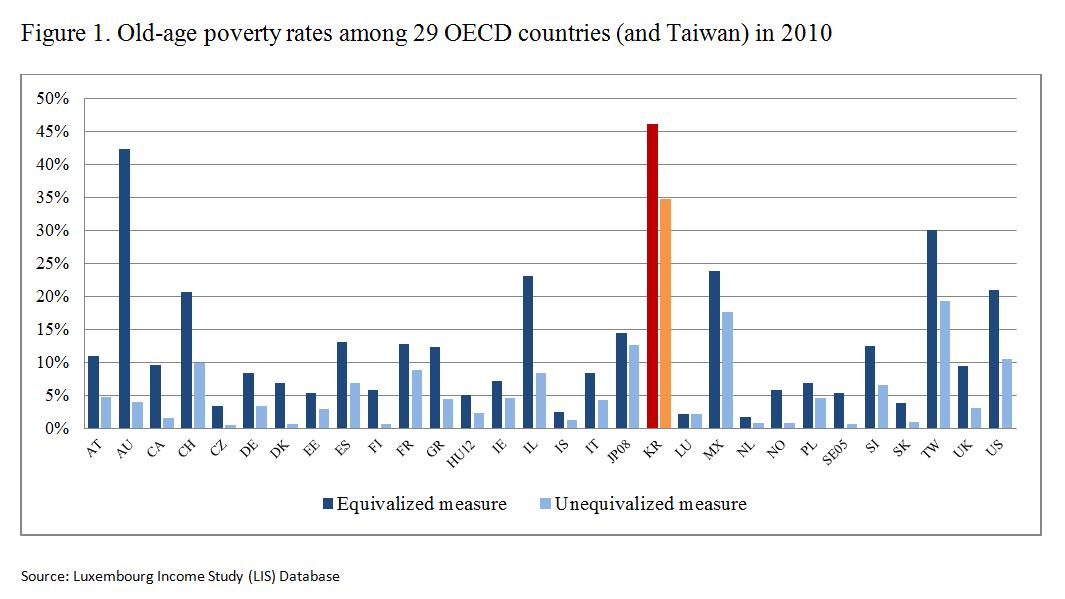
To check this potential overestimation, I measured elderly poverty rates using (unequivalized) per capita income, i.e., each member’s income is measured by household income divided by household size. The results are compared with the poverty rates using the equivalized measure (Figure 1). In some countries, including Australia, Israel, and Denmark, the alternative measure reduces the elderly poverty rates drastically (by more than 60%). But, the extent of reduction is relatively small (by 25%) in Korea, leaving its elderly poverty rate remained as high as 35 percent. This suggests that those poor elderly in Korea tend to have incomes significantly below the poverty threshold, which makes its poverty score less sensitive to different equivalence scales.
It seems valid to conclude that the elderly poverty in Korea is exceptionally high among OECD countries. The expert commentaries in the Guardian article highlighted generation-specific reasons why the current elderly people in Korea are poor. They attributed it to insufficient savings due to the expectation that adult children look after the elderly according to Confucian ethics and overspending on children’s education.
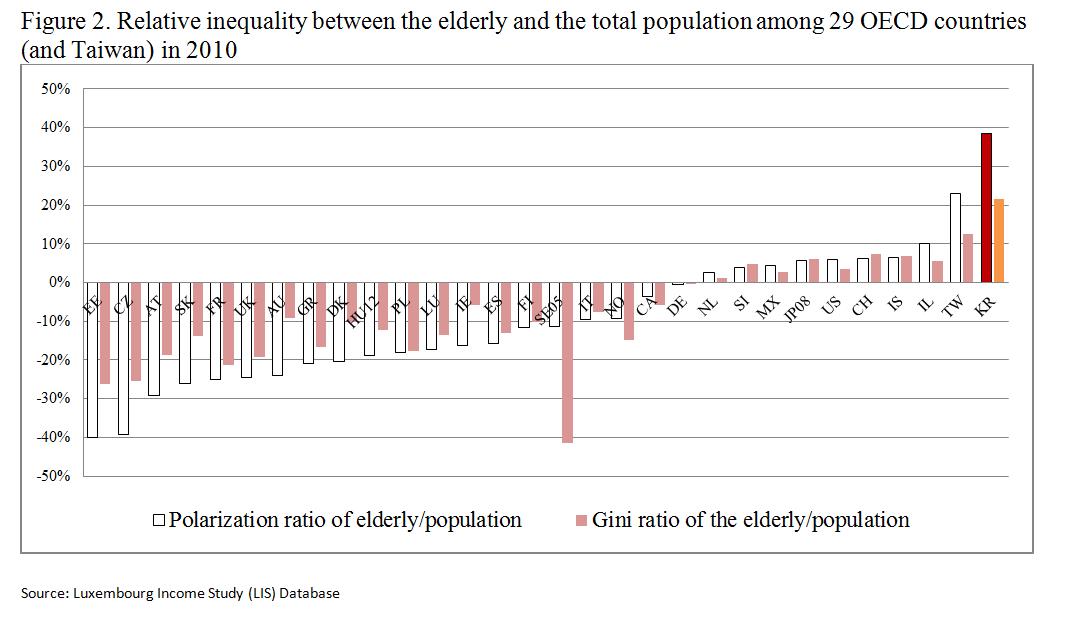
However, it needs to be cautioned to perceive this problem mainly as old-age poverty in a rich country, i.e. an inter-generational inequality issue. If the problem is mainly about poor old-aged versus well-off working-aged, the solution should be redistribution between generations. In fact, the old-age poverty in Korea reflects intra-generational inequality as much as inter-generational inequality. Figure 2 presents the relative inequality level among the elderly compared to that of the population. Using the LIS data, I measured the Wolfson and Foster’s polarization index and the Gini coefficient for the elderly and the total population. The scores represent to what extent the inequality among the elderly is higher (+) or lower (-) than that of the population. For this, I used the per capita income measure. By both measures of inequality, intra-elderly inequality relative to general inequality is the highest in Korea among 30 industrialized democracies. The Gini coefficient among the elderly is 21.5 percent higher than that of the population, while the degree of income polarization among the elderly is 38.6 percent higher than that of the population. In 20 countries, intra-elderly inequality is lower than that of the population. Among those 10 countries where intra-elderly inequality is higher than that of the population, Korea’s score is exceptionally high.
In sum, an exceptionally large share of elderly citizens in Korea lives with incomes below the poverty threshold. Equally important, such a high elderly poverty rate reflects intra-generational inequality as much as inter-generational inequality in the country. Indeed, a substantial share of Korean elderly can rely on generous pension benefits if they retired from public sector jobs, or rental incomes from their owned dwellings (Statistics Korea, 2017). In 2014, South Korean government introduced a basic old-age pension to reduce the old-age poverty. Hotly debated issues then were whether the government should provide basic pensions to all elderly or only to the poor elderly and whether the national pension funds should be used to finance it. It ended up giving a small amount (180 USD/month) to 70 percent of the elderly population, using general tax revenues. Given the significant intra-generational inequality (especially a high degree of income polarization among the elderly), it might be more effective to reduce the elderly poverty if higher benefits were given to the poorer elderly (say bottom 35 percent), while using some measures of intra-generational redistribution from the affluent elderly to the poor elderly.
References
| Förster, M. F. (1994). Measurement of low incomes and poverty in a perspective of international comparisons. OECD Labour Market and Social Policy Occasional Paper, 14. Paris: OECD. |
| LIS (2017). The Luxembourg Income Study Database. Retrieved September, 2017, from . |
| OECD (2015). Terms of reference OECD project on the distribution of household incomes. Retrieved from http://www.oecd.org/els/soc/IDD-ToR.pdf. |
| OECD (2017). The Organization for Economic Co-operation and Development Life Expectancy Dataset in Statistics for Health. Retrieved from here. |
| Statistics Korea (2017). Korean Statistical Information Service Price/Household Income and Expenditure Dataset. Retrieved September, 2017, from http://kosis.kr/index/index.jsp. |