Issue, No.2 (June 2017)
Can political scientists make use of the LWS data?
A brief note on party identification and wealth in the United States.
Political scientists have used LIS data for many years, often but not exclusively analyzing how states redistribute income through taxes and transfers. Yet there is little evidence that wealth microdata, available in the LWS database, have been utilized by political scientists with much frequency. The LWS data, especially because of the recent substantial update to the database, offer a look into many useful lines of research relevant to the field. In this brief note, we aim to highlight one of the many possible ways that political scientists can make use of the LWS data.
With the recent update, the LWS Database now contains a wealth of information (pun intended) on household assets and liabilities, some consumption trends, socio-demographic indicators, as well as labor market characteristics including behavioral variables. The scope of the database provides many opportunities, not just for economists to conduct comparative research, but also for those across the social sciences, including those from political science departments. The database does not, however, include many political indicators because it is limited to the information that national organizations include in the wealth surveys they conduct. Political scientists have two solutions to this unavoidable dilemma. First, they can append macro or regional-level policy data to the LWS data. LIS Database users have been doing this for years and LIS hosts a number of such databases on their website precisely for this purpose. Second, they can statistically match microdata from another survey to the LWS microdata. This is becoming an increasingly accepted statistical technique, and is the strategy we use in a forthcoming piece (Flynn and Paradowski, 2017) to examine the relationship between household wealth and voting behavior across the United States, Germany, and Sweden. Here, we discuss our strategy and findings for the case of the United States, in particular with respect to partisanship in the 2000 and 2012 presidential elections of George Bush and Barack Obama, respectively.
Political scientists have closely studied the relationship between income and political behavior for decades. In part because wealth data are so rare, little is known about whether a person’s wealth, which is not always correlated with income, corresponds to political behavior in the same way that income does. There are a number of reasons, in fact, to think that wealth could correlate more strongly with political activities and partisan affiliations. After all, wealth disparities are greater than income disparities, wealth holdings often signal accumulated family resources from prior generations, and as a measure, including wealth helps to accurately capture the economic resources of a household (here, think about the pensioner who owns his or her home outright.)
We statistically match data from the American National Election Study (ANES) to data from the LWS Database that comes from the Survey of Consumer Finance (SCF). This enables us to analyze the relationship between wealth and partisanship as if the data had been collected together. We employed the nearest neighbor distance hot deck method and matched the data five times using household disposable income quintiles, some labor market characteristics, education, and other demographic indicators. Those familiar with this strategy, or with multiple imputation strategies, will be aware of the similarities between the two. In a sense we can consider statistical matching as a way to ‘impute’ missing data. In our case, we have missing party affiliation data in wealth surveys. These strategies are increasingly common among both data producers and research scholars who use this technique to compile information from different surveys (see Fisher et al., 2016 for more information.)
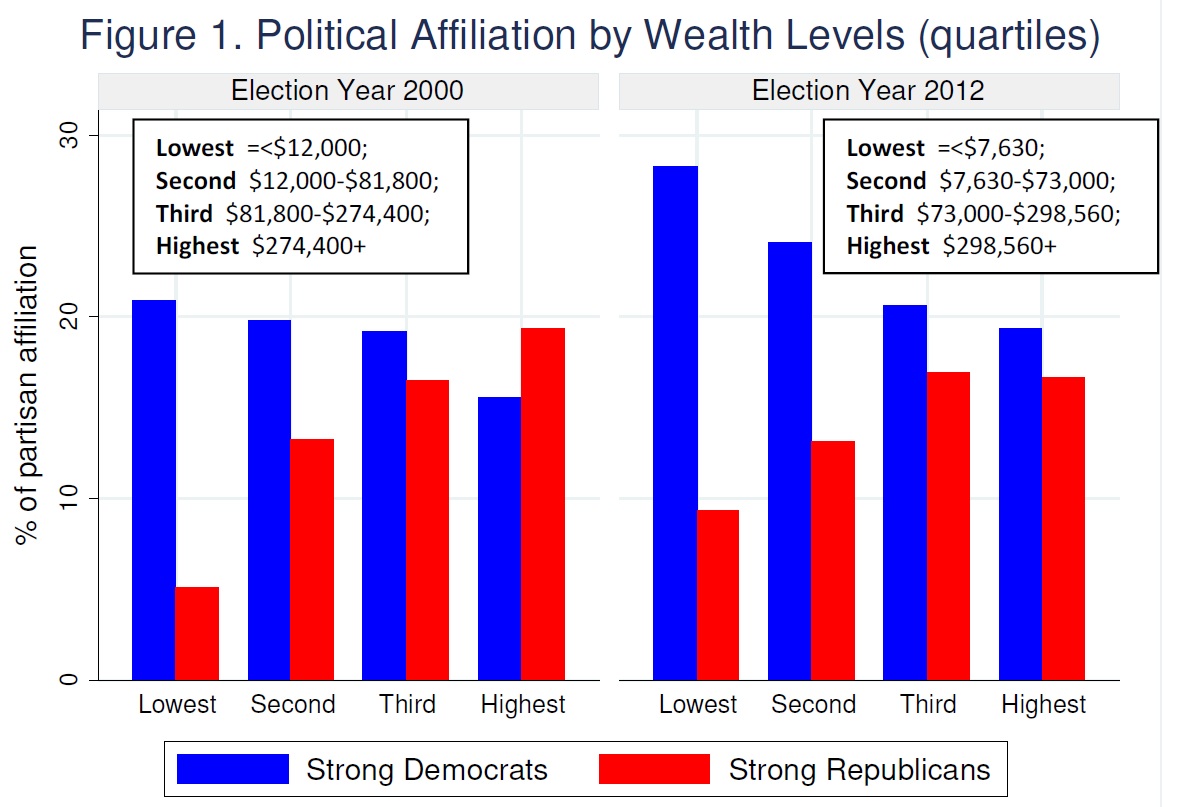
What do we find? Figure 1 presents partisan affiliation, whether someone affiliates as a ‘Strong Democrat’ or ‘Strong Republican,’ by wealth quartiles. Partisan affiliation and wealth co-vary as expected in 2000, but by 2012 the relationship takes a surprising turn. In 2000, 21% of the lowest quartile (the bottom 25%) consider themselves Strong Democrats while only 5% consider themselves Strong Republicans. This gap narrows in the second and third quartile, and reverses in the top quartile (the top 25%) where 19% consider themselves Strong Republicans. In other words, those who have less wealth affiliate more strongly with the Democratic party and those with more wealth the Republican party. In 2012, Democratic party affiliation is even more pronounced in the bottom quartile. The gap narrows less in the second and third quartiles compared to the 2000 election, and most notably, this gap does not reverse and does not disappear in the highest quartile. Even here, in the top 25% of the wealth distribution, more people consider themselves Strong Democrats than Strong Republicans – 19% to 17%.
Is this flipped dynamic important? We are, after all, looking at 2000 when a non-incumbent Republican won and 2012 when an incumbent Democrat won. Perhaps we are merely capturing the winning party’s ability to successfully mobilize their base. We do not think that is all we are capturing. If instead we are witnessing a fundamental shift in the partisan affiliation of wealthy voters (this parallels the findings in a recent piece by Bonica et al. (2013) who find that wealthy Americans now contribute more to the Democratic party), this could signal the development of a new political landscape. Will the Democratic party continue to focus its platform on reducing inequalities or, as is already evidenced by some measures, are wealthy partisans shifting the Democratic party to the right? How might such a political landscape take shape in the Trump administration and beyond? In the United States and outside? We hope more political scientists will join us in using the LWS data to examine these and other pressing political questions of our day.
References
| Bonica, A; McCarty, N.; Poole, K; Rosenthal, H. (2013), “Why Hasn’t Democracy Slowed Rising Inequality?, Journal of Economic Perspectives 27 (3): 103-124. |
| Fisher, J.; Johnson, D.; Smeeding, T.; Thompson, J. (2016) “Inequality in 3D: Income, consumption, and wealth”, Working paper series, Washington Center for Equitable Growth, September 2016, http://equitablegrowth.org/working-papers/inequality-in-3d-income-consumption-and-wealth. |
| Flynn, L. and Paradowski, P. (forthcoming 2017), “Can Unequal Distributions of Wealth Influence Vote Choice? A Comparative Study of Germany, Sweden and the United States”, in David Jesuit and Russell Alan Williams, Public Policy, Governance and Polarization: Making Governance Work, Routledge Critical Studies in Public Management. |