
Issue, No.39 (September 2026)
Income Taxation Across Countries
This article draws on “Income Taxation Across Countries” LIS Working Paper Series, No. 906 – winner of the 2025 Aldi Award at LIS.
Key messages
- Using household microdata from eleven LIS waves covering 36 countries, we show that a two-parameter log-linear function provides an accurate approximation of effective income taxation across all countries and periods in our sample. We provide country- and wave-specific estimates for use in empirical and structural work.
- Countries with higher average tax rates tend to have more progressive income tax systems. Income tax progressivity is also positively associated with economic development.
- Income tax progressivity varies systematically by family structure. Moreover, the tax-and-transfer system is substantially more progressive than the income tax system alone, indicating that transfers account for a large part of government redistribution.
Why compare effective income taxation?
Income tax systems are inherently complex, shaped by statutory rates, deductions, credits, and filing rules. This complexity is magnified in cross-country comparisons due to institutional and policy differences. Yet, accurately capturing the key features of income taxation is crucial: economists require precise characterizations of the tax system to study the effects of tax policies on individual and aggregate behavior, and policymakers need reliable measures of tax progressivity to design effective redistribution and social insurance policies.
Our LIS Working Paper (Qiu and Russo 2025) pursues two main goals. The first is to systematically describe and compare effective income taxation across countries. The second is to provide estimates of effective tax functions that can be readily used in empirical and structural work. Effective tax functions characterize the empirical relationship between taxes paid and pre-tax income and summarize the combined effect of the many provisions embedded in tax systems.
We use the two-parameter log-linear tax function introduced by Feldstein (1969) and Benabou (2000) and subsequently popularized by Heathcote, Storesletten, and Violante (2017). Previous work has used this function primarily for the United States, although a smaller literature has applied it to individual countries and cross-country samples. Our contribution is to estimate comparable effective income tax functions for a much broader set of countries and periods and to use them to document how average taxation and progressivity vary with economic development and family structure.
Our analysis uses 7,595,640 household-wave observations from the Luxembourg Income Study (LIS) Database. The final sample contains 36 countries observed across eleven LIS waves, spanning the early 1970s to 2019.
A common framework for comparing tax systems
To compare effective income taxation across countries, we apply the same income definitions, sample restrictions, and estimation method to every country and LIS wave in our sample.
We define household pre-tax income as the sum of labor income, capital income, private transfers, pensions, and public social benefits. Post-tax income is pre-tax income minus income taxes and social security contributions. To improve comparability across countries, we impose a number of restrictions on the sample. In particular, we restrict our focus to households whose head is between 25 and 60 years old and focus on four “standard” household types: singles without children, single parents, married couples without children, and married couples with children.
We use the two-parameter log-linear tax function:
log(post-tax income) = log(1 − λ) + (1 − τ) log(pre-tax income).
In this function, the parameter λ represents the average level of taxation, while the parameter τ governs progressivity, as 1 − τ is the elasticity of post-tax income with respect to pre-tax income.
The tax system is progressive when τ > 0, regressive when τ < 0, and flat when τ = 0. A larger value of τ implies that post-tax income rises less than proportionally with pre-tax income and hence that the tax system is more progressive.
Despite its simplicity, the function approximates effective income taxation remarkably well. Across all country-wave regressions, the mean R2 is 0.976 and the median is 0.984. The lowest R2 is 0.86. While previous research established the quality of this approximation for the United States and a few other countries, we show that it extends to every country and period in our sample. This consistently high fit makes the resulting country- and wave-specific parameters a parsimonious representation of effective income taxation for use in empirical and structural work.
Average taxation, progressivity, and economic development
Figure 1 plots income tax progressivity against the average tax rate paid by the median-income household in each country in LIS wave 8, corresponding to 2010. The figure shows a positive association: countries with more progressive income taxes also tend to impose higher average tax rates. The same relationship appears in the other LIS waves included in our analysis.
Our estimates also reveal large differences across countries. Germany, Belgium, and the Netherlands combine relatively high average tax rates with high progressivity. In contrast, Brazil, Colombia, Peru, and the Republic of Korea have almost flat effective income taxes in most waves despite having progressive statutory tax schedules. Using the progressivity tax wedge, an alternative transformation of our progressivity parameter, the income tax systems of Belgium, Finland, Germany, Iceland, Ireland, the Netherlands, and Spain in 2010 are more than twice as progressive as that of the United States. Our estimates are broadly consistent with previous studies based on survey and administrative data (Guner, Kaygusuz, and Ventura 2014; Holter, Krueger, and Stepanchuk 2019; Tran and Zakariyya 2021).
Figure 1: Tax Progressivity and Average Tax Level
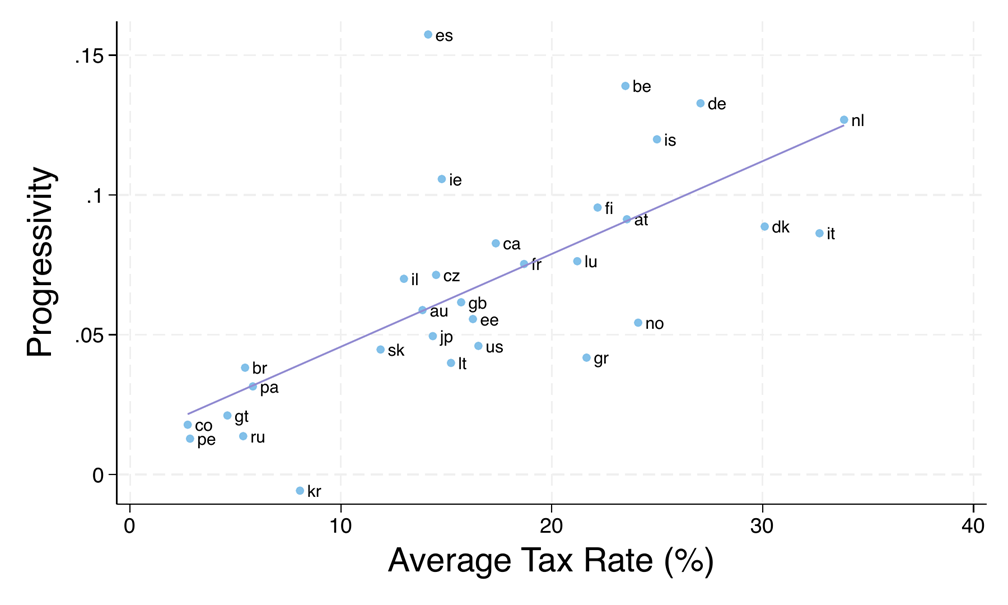
Notes: Progressivity against the average tax rate in LIS wave 8 (2010). The average tax rate is evaluated at the median income of each country. The solid line is the OLS fitted line.
We next examine how progressivity varies with economic development. The tax-capacity literature documents that high-income countries collect a larger share of tax revenue through personal income taxes, whereas lower-income countries rely more heavily on taxes on goods and services (Besley and Persson 2014). We ask whether higher-income countries also have more progressive income tax systems.
Figure 2 plots progressivity against median household income in 2010. This figure shows that richer countries tend to have more progressive income tax systems. Belgium, Germany, and the Netherlands are among the countries with both high median income and high progressivity, whereas Guatemala, Colombia, and Peru are at the lower end of both distributions. The positive relationship appears consistently from 1995 onward, and it is also present when development is measured using mean household income or GDP per capita.
These results line up with the differences in tax-revenue composition. In 2010, Denmark and the United States collected about half of their tax revenue through personal income taxes, while Peru and Guatemala collected less than 10 percent. Lower-income countries in our sample both rely less on income taxation and display lower effective income tax progressivity.
Figure 2: Tax Progressivity and Development
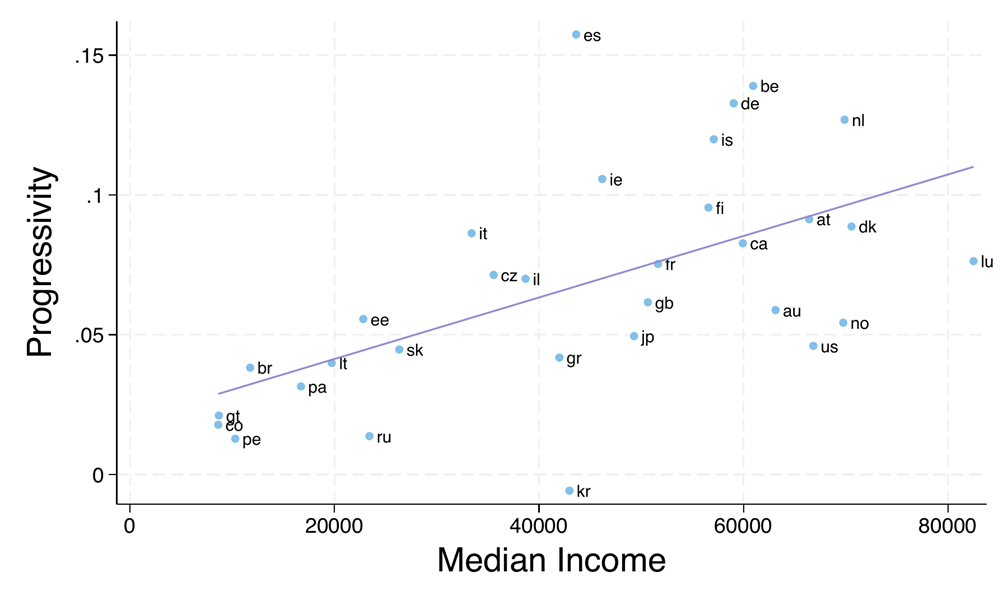
Notes: Progressivity against median income in LIS wave 8 (2010). Progressivity is measured by τ, and income is measured in 2017 USD PPP. The solid line is the OLS fitted line.
Progressivity differs across family structures
Tax systems often distinguish households by marital status and the presence of children through joint taxation, deductions, and tax credits. A single country-level tax function can therefore conceal substantial differences across household types. We estimate separate functions for married couples with children, married couples without children, single parents, and singles without children.
Figure 3 reports the results for six countries in 2010 and shows that progressivity varies markedly across family structures. Conditional on the presence of children, marriage is associated with higher progressivity. The progressivity parameter is, on average, 25.6 percent higher for married couples without children than for singles without children and 27.1 percent higher for married couples with children than for single parents.
Conditional on marital status, the presence of children is also associated with higher progressivity. Progressivity is 18.5 percent higher for married couples with children than for married couples without children. The difference between single parents and singles without children is smaller, at 5.9 percent. Despite variation across countries and periods, a stable ordering emerges in most country-wave observations: singles without children face the lowest progressivity, while married couples with children face the highest.
Figure 3: Income Tax Progressivity by Family Structure
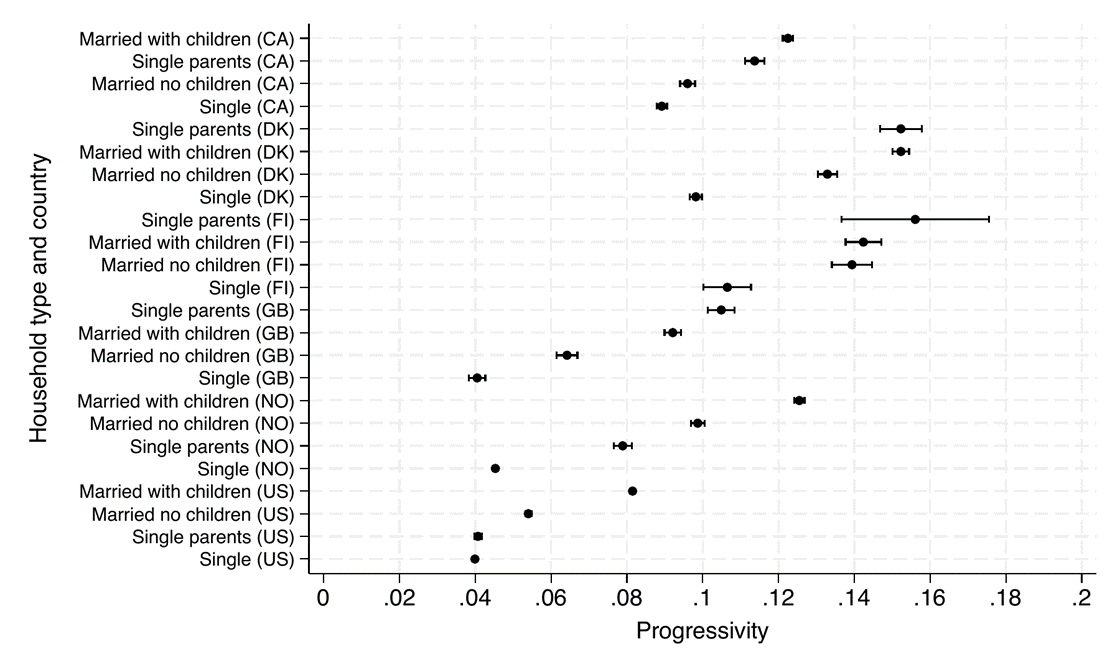
Notes: LIS wave 8 (2010). Dots are estimates of the progressivity parameter τ; horizontal lines show 95 percent confidence intervals. Within each country, household types are ordered from least to most progressive. Country codes are CA for Canada, DK for Denmark, FI for Finland, GB for the United Kingdom, NO for Norway, and US for the United States.
The role of transfers
Our primary analysis focuses on income tax progressivity. Public social benefits are included in pre-tax income, allowing us to isolate the mapping from income before taxes to income after taxes. Governments, however, also redistribute through transfers. To assess their role, we estimate a tax-and-transfer function in which public social benefits are included in post-tax rather than pre-tax income.
Figure 4 compares the two measures and shows that the tax-and-transfer system is substantially more progressive than the income tax system alone in every country shown. Including transfers does not substantially alter the ranking at the extremes: countries with high income tax progressivity also tend to have high tax-and-transfer progressivity. The difference between the two functions indicates that a large part of government redistribution is carried out through transfers, particularly at the bottom of the income distribution.
The broader measure must nevertheless be interpreted with care. Transfer programs differ substantially across countries, transfer income is frequently misreported in household surveys, and the log-linear function fits the tax-and-transfer relationship considerably less well than it fits income taxation. Estimates are also sensitive to the treatment of low-income households. When the bottom of the pre-tax income distribution is excluded, estimated tax-and-transfer progressivity falls sharply because these are the households for which transfers are most important.
Figure 4: Progressivity of the Tax and Tax-and-Transfer Functions
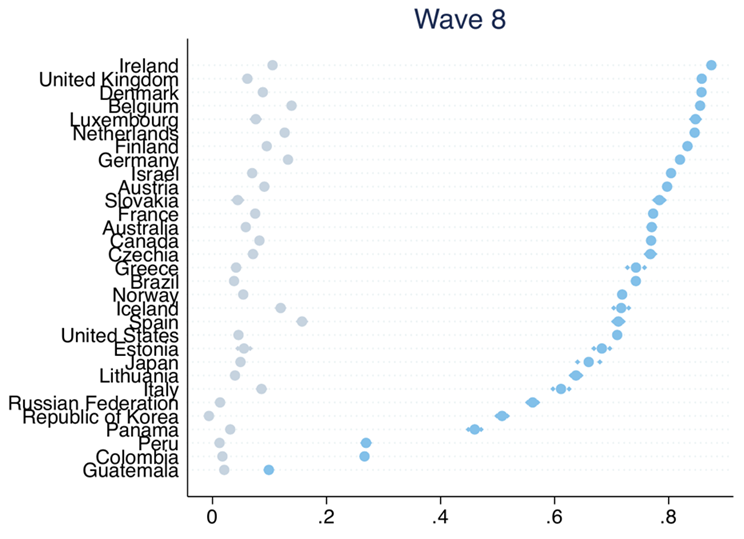
Notes: LIS wave 8 (2010). Gray dots denote progressivity estimated using the income tax function, while blue dots denote progressivity estimated using the tax-and-transfer function. Smaller dots show the corresponding 95 percent confidence intervals.
Concluding remarks
We provide comparable estimates of effective income tax functions for more than thirty countries over the past forty years. A two-parameter log-linear function approximates income taxation well throughout the sample and offers a parsimonious representation that can be used in empirical and structural work.
The estimates document considerable variation across countries and households. Higher average taxation is associated with higher progressivity, and richer countries tend to have more progressive income tax systems. Progressivity also differs substantially by family structure: marriage and the presence of children are associated with higher progressivity. Finally, income tax progressivity alone does not capture the full extent of government redistribution. Once public social benefits are included, the estimated progressivity of the tax-and-transfer system is substantially higher.
References
| Benabou, Roland. 2000. “Unequal Societies: Income Distribution and the Social Contract.” American Economic Review 90 (1):96–129. |
| Besley, Timothy and Torsten Persson. 2014. “Why Do Developing Countries Tax So Little?” Journal of Economic Perspectives 28 (4):99–120. |
| Feldstein, Martin S. 1969. “The Effects of Taxation on Risk Taking.” Journal of Political Economy 77 (5):755–764. |
| Guner, Nezih, Remzi Kaygusuz, and Gustavo Ventura. 2014. “Income Taxation of U.S. Households: Facts and Parametric Estimates.” Review of Economic Dynamics 17 (4):559–581. |
| Heathcote, Jonathan, Kjetil Storesletten, and Giovanni L. Violante. 2017. “Optimal Tax Progressivity: An Analytical Framework.” The Quarterly Journal of Economics 132 (4):1693–1754. |
| Holter, Hans A., Dirk Krueger, and Serhiy Stepanchuk. 2019. “How Do Tax Progressivity and Household Heterogeneity Affect Laffer Curves?” Quantitative Economics 10 (4):1317–1356. |
| Qiu, Xincheng, and Nicolò Russo. 2025, “Income Taxation Across Countries.” LIS Working Paper Series, No. 906. LIS Cross-National Data Center in Luxembourg, https://www.lisdatacenter.org/wps/liswps/906.pdf. |
| Tran, Chung and Nabeeh Zakariyya. 2021. “Tax Progressivity in Australia: Facts, Measurements and Estimates.” Economic Record 97 (316):45–77. |