Issue, No.35 (September 2025)
Who Thrives and Who Falls Behind? Household Income Differences in Luxembourg and its Neighbouring Countries
Luxembourg is a highly distinctive country in the heart of Europe. Nearly half of its resident population holds foreign nationality, and every day a massive inflow of cross-border commuters from neighbouring countries contributes to its labour market. This unique demographic and economic situation raise important questions: Who thrives in Luxembourg, and who faces a greater risk of exclusion? Should people stay, leave, or even commute across the border to benefit from its opportunities?
With the September 2025 LIS data release, new annual data series became available for Luxembourg (LU22, LU23), France (FR21, FR22), and Germany (DE21, DE22). This article uses these, as well as the earlier datasets from these three countries and Belgium, to examine median income differences across household types. Such differences are crucial for understanding inequality. Comparing Luxembourg with its three neighbours helps to identify key institutional features (e.g., pensions, family benefits, taxation) and assess the adequacy of social protection. These institutional differences influence behavioural and cultural patterns (e.g., persistence of the male breadwinner model). As a result, groups such as single parents or pensioners may be more vulnerable than couples with children. A long-term, cross-country perspective provides valuable insights into the effectiveness of past policies and guides the design of future labour market and social protection systems.
Some reflections on core differences across groups and data preparation
In advanced economies, household income is primarily shaped by two sources: labour and pensions. The working-age population derives most of its income from labour, while older cohorts are protected by pension schemes that provide either income maintenance or minimum support in retirement. Children, up to a certain age, are indirectly protected through family support benefits paid to their parents or guardians. Household structure therefore plays a decisive role in analysing income differences.
In this article, households are grouped into six clusters: 1
- one-person households aged below 65 or not retired
- one-person households aged 65 and above and not mainly working
- couple households aged below 65 or both not retired
- couple households aged 65 and above and both not mainly working
- single-parent households with dependent children
- couple households with dependent children
Figure 1 illustrates the main differences across the four countries between these six groups over time. Each point shows the group median relative to the overall median in the respective year. For example, the median income of all persons in single-parent households in LU23 represents 71.3% of the national median in LU23. More generally, when the ratio is above 1, the median person in that group is doing better than the societal median.
Figure 1. Median income by group in relation to societal median
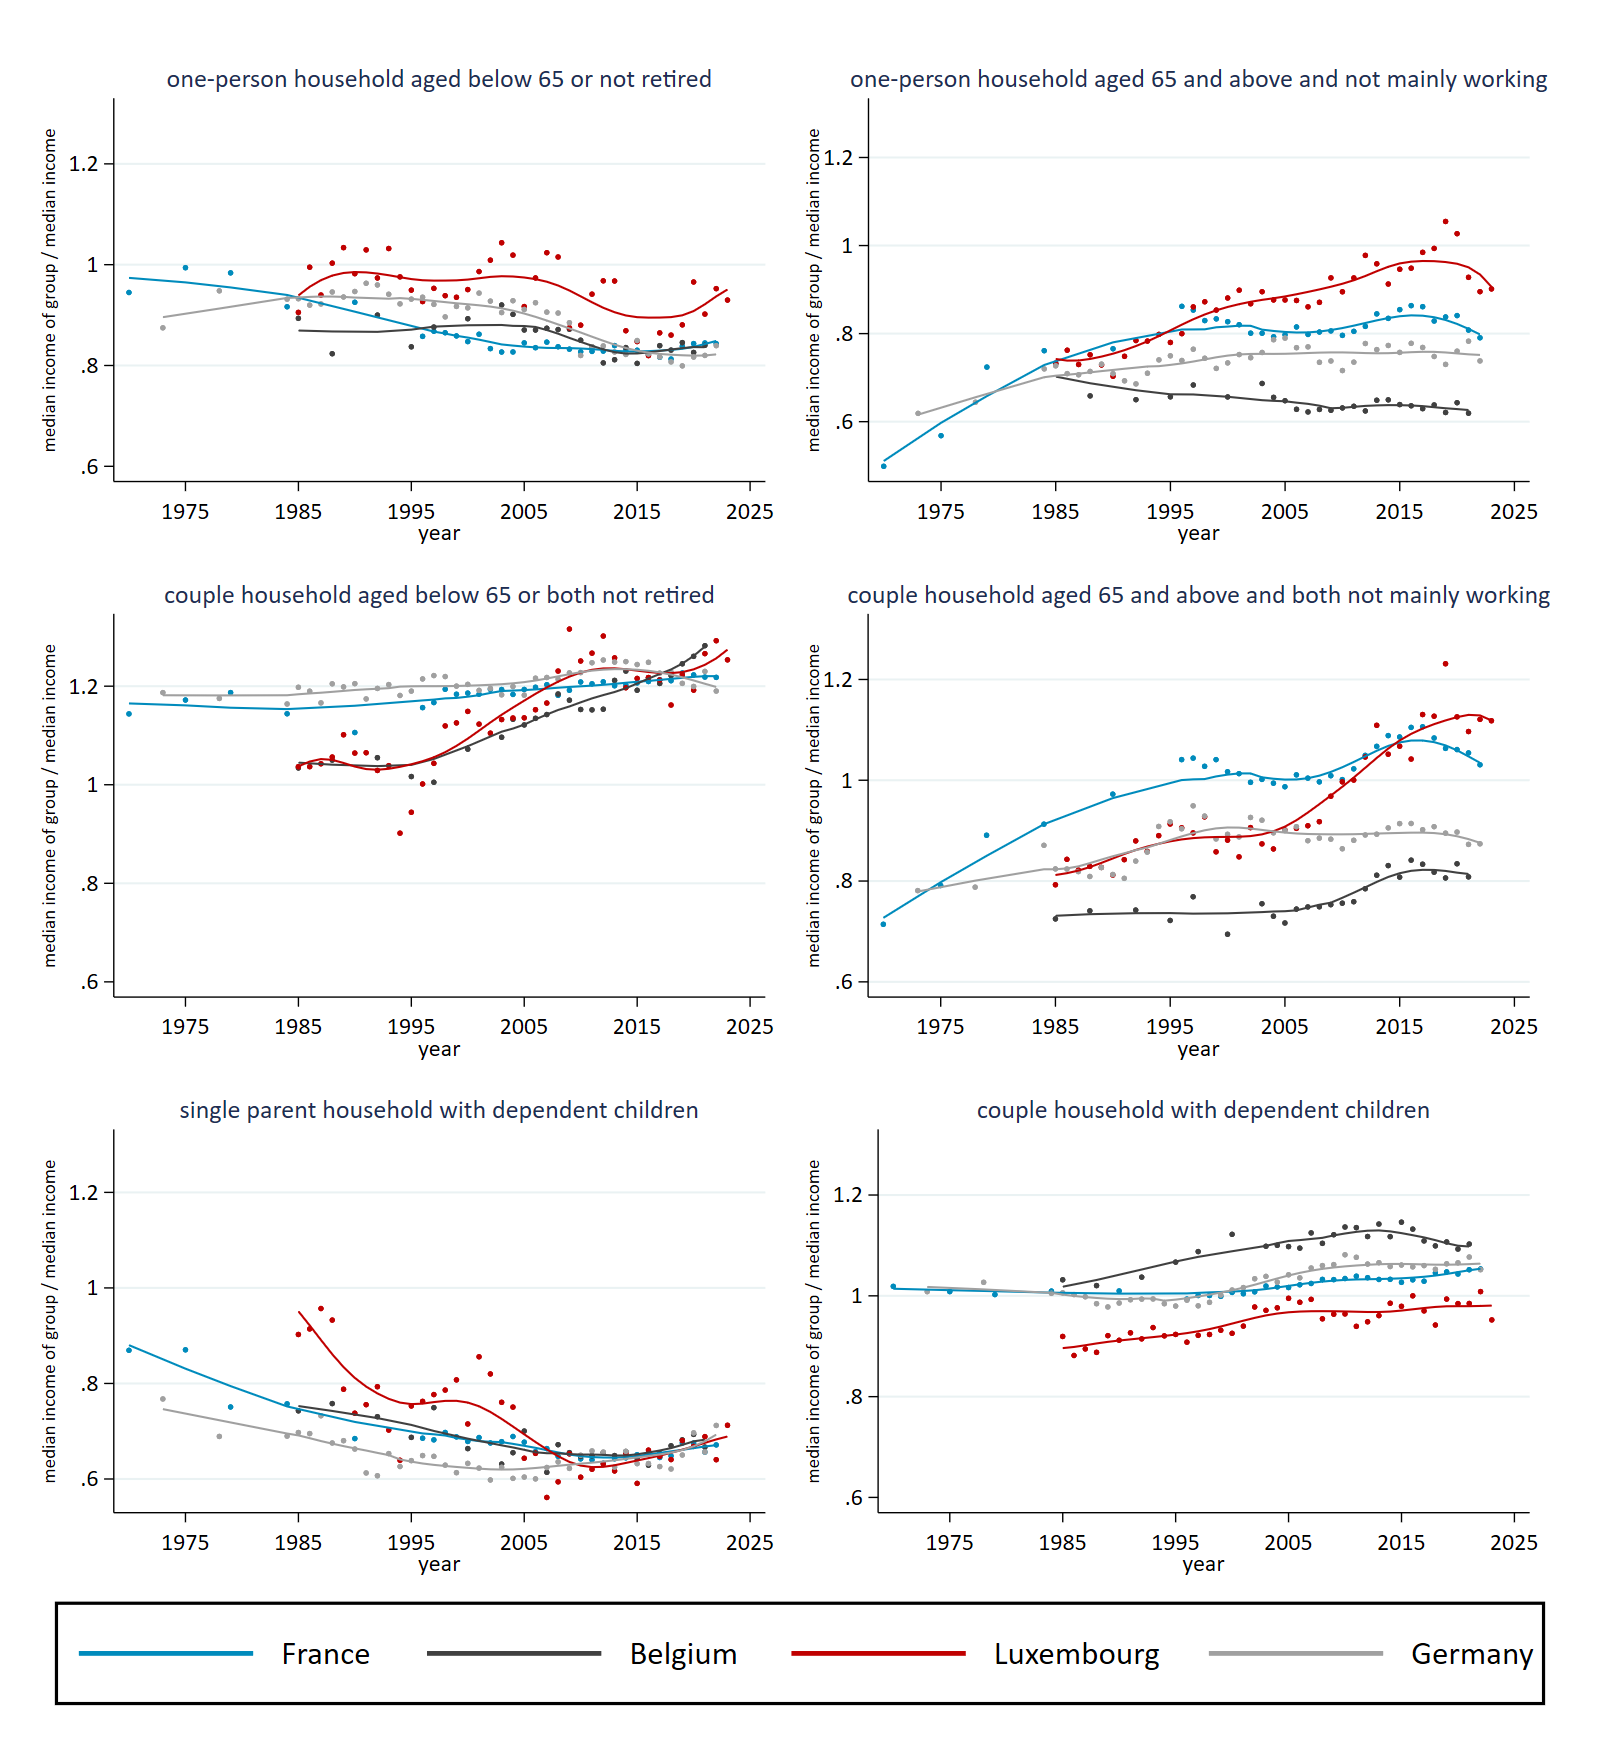
Notes: Dependent children are considered those below 18 years and those aged 18-24 enrolled in education, and living in the same household. Disposable household income is divided by the square root of household members to reflect economies of scale.
Source: own calculations based on Luxembourg Income Study (LIS) Database.
The most persistent gap in economic well-being is between single-parent households and couple households where both partners are not retired. This holds across all four countries, though additional insights emerge from the long-term trends. Across all four, single-parent households saw a considerable decline in well-being from 1985 to 2005. Since 2005, Germany has reversed this decline, possibly linked to the more flexible labour market structure and the introduction of Mini jobs in 2003 , albeit the extent to which such jobs lead to stable employment is heavily debated. In the early 2000s, Germany’s ratio stood at 0.6, meaning every second person in this group was at risk of relative poverty at the 60% benchmark. Luxembourg reached a similar situation in the late 2000s. In response, Luxembourg expanded childcare solutions that improved parents’ ability to reconcile work and family. The maisons relais offered before- and after-school care and have since “become an indispensable part of the educational system: around 70% of parents currently rely on after-school care or care outside of normal school hours.” In 2009, the Chèque-Service Accueil (CSA) introduced free hours and reduced rates for child care, while the Crédit d’impôt monoparental (CIM) established favourable tax rules for single parents. More generally, efforts in all countries to help parents reconcile work and family responsibilities, either through institutions or parents’ own strategies, have gradually reduced the well-being gap for single-parent households since the 2010s.
By contrast, the least vulnerable appear to be non-retired couples without children. In France and Germany, their income has consistently been around 20% above the societal median. In Belgium and Luxembourg, however, couples’ income remained close to the overall median until the 2000s, after which it steadily increased and slightly exceeded the French and German levels in the latest years. Rising labour market participation of both partners likely explains this pattern.
The most striking argument to stay in Luxembourg seems to be retirement income. Over time, one-person and couple households benefitted from a maturing pension system.2 Luxembourg offers rather generous pensions for those with long working careers in Luxembourg. Luxembourg belongs now to the few countries where disposable income of the 65+ exceeds 100% of the total median, coinciding with one of the lowest poverty rate for the elderly in the OECD. Figure 1 displays the latest increase for the retired households over time. Since the mid 1980s, the ratios rose gradually from 0.75 to 1.0 for one-person households and 0.8 to 1.1 for couples. For couples, Luxembourg surpassed France around 2015, while one-person retirees had already overtaken before 2000. France maintains comparatively high ratios, while Germany shows lower and more stable levels. Belgium lags behind considerably. More recently, however, Luxembourg’s ratios have plateaued and even dipped slightly relative to the societal median. Strong wage increases in the context of the inflation crisis may explain this development. Importantly, Luxembourg’s indexation system ensures that both wages and pensions are regularly adjusted to real wage trends.
Last but not least, how are families in Luxembourg? Besides the improved care institutions mentioned above, families see preferential tax treatment and receive various child allowances. Yet, couples with dependent children perform worst in relative terms across the four countries. While the German and French levels are consistently around the median and slightly moving above to 105% lately, the Luxembourgish ratio remained around 90% and only lately is gradually approaching 100%. It should be noted that all figures are relative to the other household groups. Accordingly, Belgium reports the highest ratio in one category, namely couples with dependent children. At the same time, there is evidence that the Belgian family policy system decreases the risk of poverty fundamentally in comparative perspective.
Where to go from here?
Figure 1 offers some policy implications. Linking observed gaps in well-being to institutional characteristics helps explain why certain groups fare better in specific countries. Luxembourg offers highly competitive wages compared to its neighbours, making it an attractive workplace for cross-border commuters. However, it also has one of the highest price levels in Europe, with housing affordability a growing concern: the house-price-to-income ratio has been among the highest in the EU for years. These costs offset some of the benefits of child allowances and the CSA.
So, should you come, stay, leave, or commute to Luxembourg? The answer depends on the individual’s preference and circumstances. Luxembourg City, with an immigrant share of 72.7%, is highly multicultural. At the same time, the country provides a robust social security system, enabling workers to accumulate generous pension entitlements under current rules, as shown in the OECD simulations of gross and net pension replacement rates.
The presented figures revealed that only one of the household types lags consistently behind, single parents. Luxembourg is no exception from its neighbour countries in this respect. Additional research is needed to identify groups at risk, particularly regarding education, labour market institutions, and access to jobs in Luxembourg. The Luxembourg series in the LIS Database (LU85–LU23) offers a rare long-term lens to assess how institutional reforms shape household well-being. Further comparative research will not only shed light on Luxembourg’s distinct path but also position its policy solutions within broader debates on welfare and labour market design in an increasingly mobile, diverse Europe.
1 The definition of ‘mainly working’ follows the construction of the LIS variable lfs. Dependent children follow the construction of LIS variable typehh, which considers dependent children all those below 18 years and those aged 18-24 enrolled in education and living in the same household with their parents. Disposable household income is divided by the square root of household members to reflect economies of scale in larger households, the common LIS procedure in economic well-being measurement based on income. The total income is equally assigned to all household members.
2 Institutional detail about the pension scheme can be found here.