Issue, No.20 (December 2021)
Harmonisation of Annual Micro Data for Colombia: Gross vs. Net and the Twilight of Inequality
Being aware of the previous challenges during earlier harmonisation procedures of Colombian data, we confidently started the annualisation in early summer this year. In order to create an annual series of income data for the LIS Database, we acquired the monthly samples of the Continuous Household Survey (ECH) from July 2001 to June 2006, and the monthly samples of the Great Integrated Household Survey (GEIH) from January 2007 until December 2020.1 The data are rich in terms of dwelling characteristics and household composition, as well as, at the individual level, general characteristics, health social security, education and especially labour market information, including detailed data on earnings and other incomes. We were happy to note that the switch from the ECH to the GEIH has had little impact in terms of contents of the questionnaire: most of the information is collected in a similar fashion, with some differences in the way earnings questions were asked, as well as a lower level of detail for non-labour incomes in the ECH with respect to the GEIH. However, we had to learn quickly that creating a consistent annual series from the two series is a challenging endeavour. In this article, we concentrate on describing the mixed collection of gross vs. net income information. We explain how we first went to gross income and then simulated income taxes and social contributions to arrive at net income. We then realised that the two surveys yield rather different inequality levels. Thus, we further analyse mean and median income trends, and the income mix of the Colombian society by ventiles in order to i) get a better sense of limitations in comparability of the two series and ii) better understand the comparatively high inequality in Colombia.
Let us proceed with describing the main restriction in creating comparable data files according to the LIS framework for income. In both surveys, wages and wage-like income from self-employment professions are collected before deduction of taxes and contributions withheld at source – possibly because of the strong labour market connotation of the survey and hence the interest for gross earnings. On the other hand, pension incomes (which are presumably the only other regular income on which withholding deductions may apply) are asked net, hence after such deductions, which are also not available separately. This creates a mix of net and gross income amounts when trying to aggregate the different subcomponents of income into a measure of total household income, whereby neither total gross household income, nor disposable household income are easily obtainable.
Since disposable household income is the core LIS measure of well-being, we had to resort to apply a procedure for the estimation of income taxes and social contributions based on the declared income amounts. With a progressive income tax system of graduated marginal tax rates applicable to the totality of taxable income (which includes earnings, pensions and capital income), the first step was to compute a measure of total household gross income from all taxable sources, which implied grossing up the reported net pension amounts.2 In a second step, income taxes and contributions (for health, pensions and solidarity fund) payable on the total gross taxable income were estimated.3 As a result, both gross and net total household income measures were created complying with the LIS framework.4
Having applied the procedures for grossing up and estimating taxes and contribution (thus netting down afterwards), we now proceed to analyse the data, with a view to the overall comparability of the series. A very first look at the resulting data shows that, at the median, the absolute values of the main income aggregates exhibit a smooth (mostly increasing) trend over the whole period (see Fig. 1.1). On the other hand, the mean values (see Fig. 1.2) show a clear jump in between the two series, where the absolute numbers for the years 2001 to 2006 (corresponding to the ECH) are at a clearly lower level than those for the period corresponding to the GEIH (2007-2020). This jump in the mean, which is not reflected in the median, indicates that the upper half of the distribution of the GEIH series is denoted by comparatively higher values than those of the ECH, hence pointing that the GEIH has a stronger coverage of the top part of the distribution.
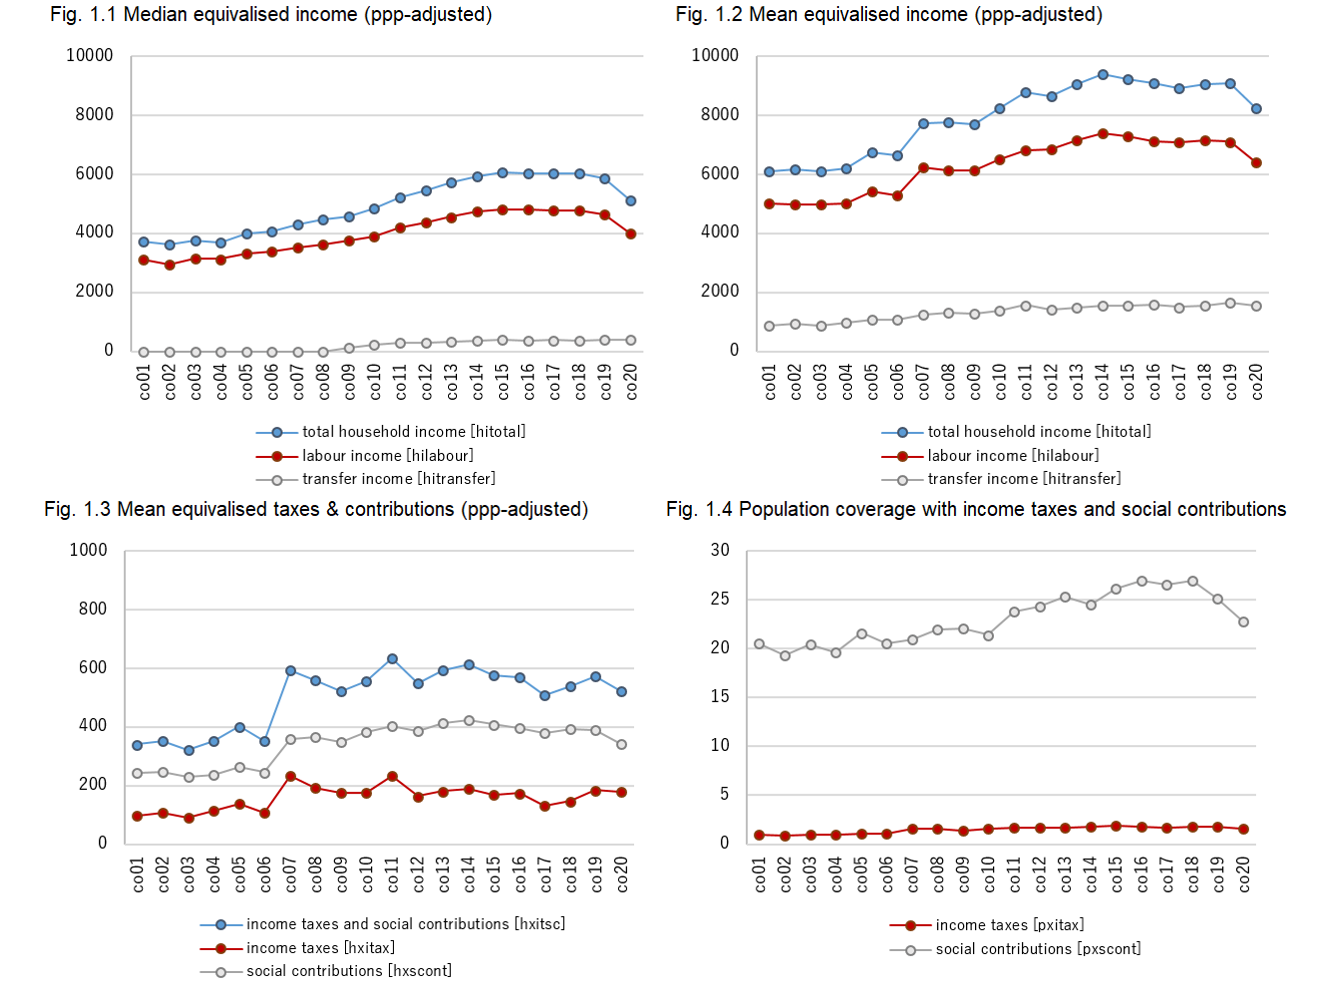
This difference between the two series becomes clearer when looking at the tax simulation results (see Fig. 1.3), where the jump between 2006 and 2007 is even more evident. This can easily be explained by the fact that, given the very large exemptions and deductions existing in Colombia, social contributions, and especially income taxes, are collected almost exclusively on incomes belonging to the top of the distribution (after modelling tax brackets and exemptions, only about 1 to 2% of the population is taxed in the micro data, as can be seen from Fig. 1.4). Since the top of the distribution is less well covered in the ECH, the difference in the amounts of taxes and contributions between the two series is very marked. The reliability of the simulation of taxes and contributions is analysed in the Box 1 below.
Note: Incomes have been equivalised by using the square root scale.
Source: Luxembourg Income Study (LIS) Database.
Box 1 – National Accounts comparison of taxes and contributions
In order to assess the reliability of the simulation of taxes and contributions, we compared the total amount of taxes and contributions as resulting from the simulation and inflated to the total population, to the corresponding aggregates from the National Accounts (as derived from the OECD tables on detailed National Accounts for the household sector). The break in series between the two surveys is clearly visible: the coverage ratio of the simulated taxes and contributions (see Fig. 2, red line) clearly goes up in the GEIH, reflecting the stronger coverage of the top part of the distribution. Nevertheless, starting from 2012 it experiences a constant decline; the drop seems due to a substantial increase in the National Accounts numbers (whereby the NA aggregate substantially increases between 2011 and 2015, whereas the inflated microdata continue to show a slowly increasing trend over that same period period).
Fig.2. National Accounts comparison
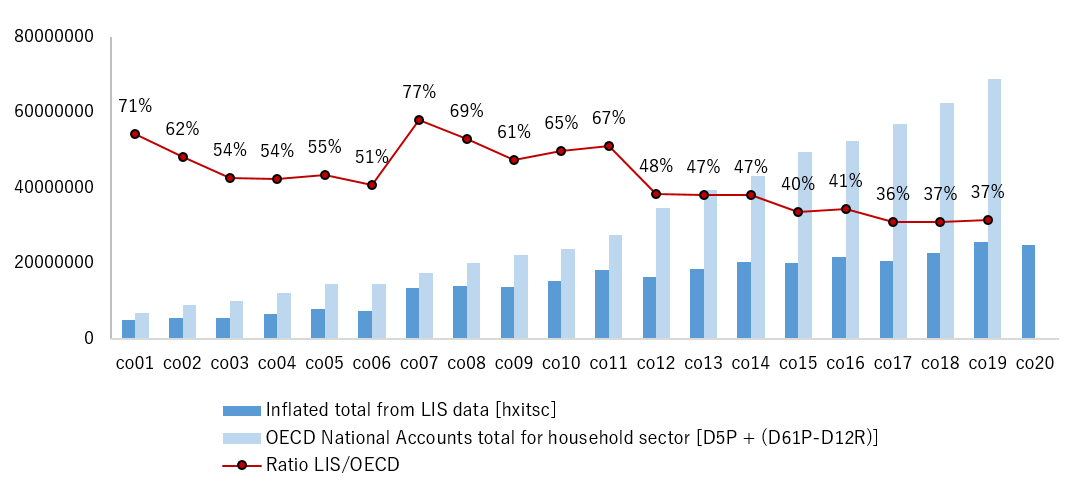
Note: More detailed coverage rates for all income subcomponents (not shown here) show that coverage rates range from about 60% for wages to 50% for social benefits, to about 40% for other incomes: the comparison to National Accounts points to a substantial underestimation of the households incomes, possibly deriving from the large informal sector existing in the country.
The increased coverage of the GEIH of the top end of the distribution is clearly visible in the trend of inequality indicators. The Gini index seems to undergo an upwards shift when going from the ECH to the GEIH (see Figure 1 in Estgen (2021) in this issue). While the data underlying the two surveys do not seem to lend themselves well for an over-time analysis of the level of inequality, the trend and shape of the inequality can still be easily analysed over time. For example, the difference between the Gini calculated on gross and disposable income (as can be seen in that same figure) remains constant throughout the overall period, denoting an altogether low level of public redistribution through taxes and transfers.
In order to better understand the pattern of the high level of inequality in Colombia, we conclude the article with an analysis of the way in which three major income subcomponents (earnings, retirement pensions and capital income, and other income) are distributed across the population. Fig. 3 shows the share of each of these subcomponents for each of the 20 ventiles of the total disposable income distribution and for each year, where the blue cells mark the ventiles with the highest income shares, and the red ones the lowest ones.
Fig.3. Income mix by ventiles
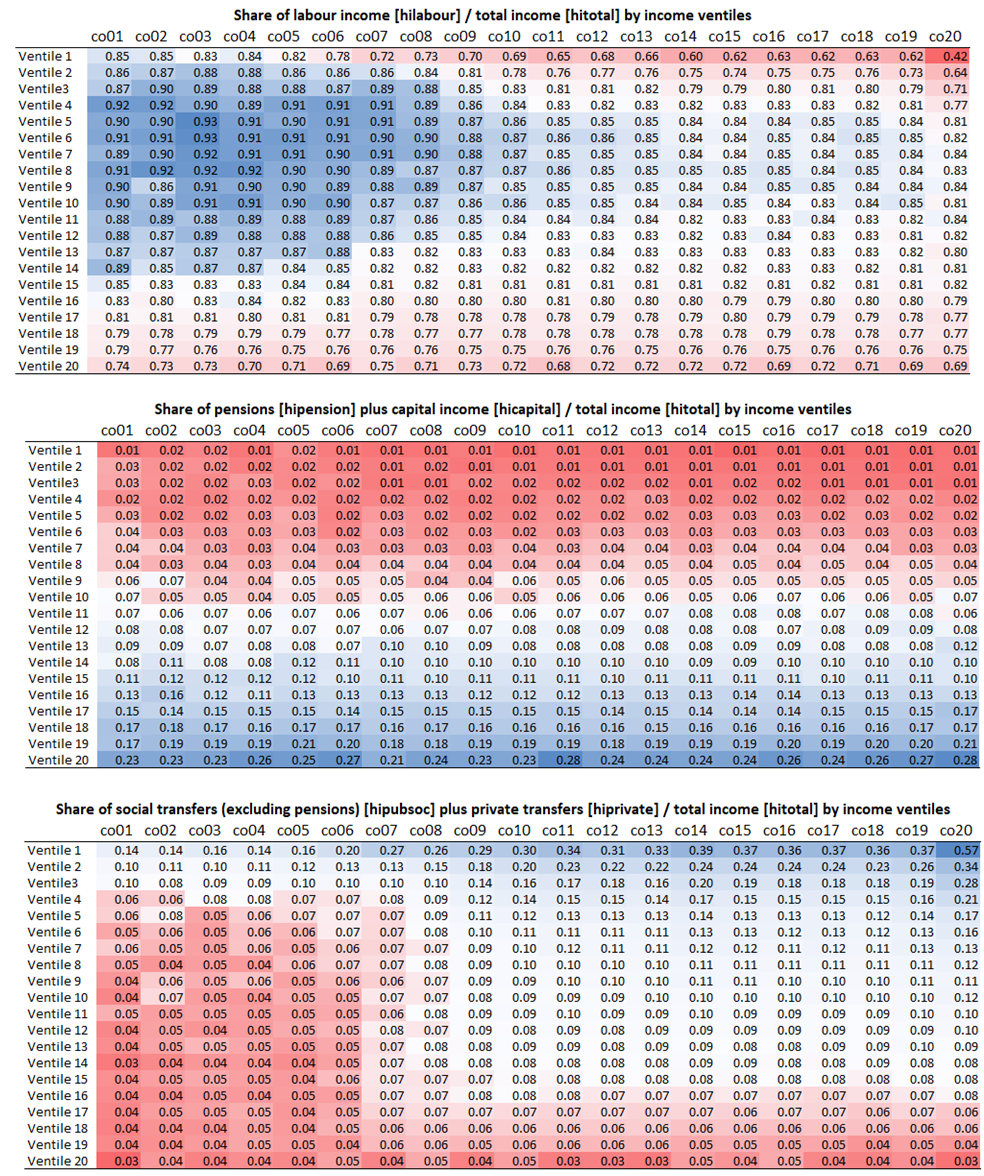
Source: Luxembourg Income Study (LIS) Database.
These numbers suggest, first and foremost that labour income is by far the highest income source for the whole period and for all ventiles. This finding is even stronger in the middle of the distribution and for the early part of the series, where most shares in the third to tenth ventiles amount to around 90 per cent. On the other hand, pension and capital income, when it is reported, is clearly only received by the households at the top of the income distribution – and increasingly so over time. While this is to be expected for capital income, the unequal distribution of pensions hints to the large informality of the Colombian labour market (where only three out of ten men and two out of ten women above retirement age receive retirement pensions). Other social public benefits (the survey is unfortunately not too specific about recipiency of certain benefits) gradually become more important at the bottom of the distribution (this becomes extreme in the year 2020 due to the impact of the COVID19 pandemic). We would have liked to have more information on individual social assistance programs, particularly social pensions, in order to generate a better split in pensions versus other social transfers. Summing up, a clear trend can be observed. Labour earnings are increasingly offset by social assistance and private transfers at the bottom of the distribution and by pension and capital income at the top of the distribution. Further research is needed to better understand how these two consistent patterns affect the overall shape of the inequality, particularly the recent upwards trend in Gini from 2018 onwards.
In conclusion, in this article we described the particular challenges that arose during harmonisation of the annual Colombian micro data series. The data for Colombia have been taken from two different surveys, the Continuous Household Survey (ECH) for 2001 until 2006, and the Great Integrated Household Survey (GEIH) from 2007 onwards. While allowing for an in depth analysis of inequality at any point in time across the Colombian society, it became evident that there is a break between the two surveys – inequality levels cannot be interpreted as a consistent over-time trend. While looking at mean and median trends, we noted a clear shift in increased representation of better off population groups from 2007 onwards. In addition, after estimation of taxes and contributions, we need to acknowledge that since 2012 the overall magnitude of taxes and social contributions shows a rather flat trend as opposed to the increasing National Accounts numbers. This may suggest that the top end of the income distribution seems less covered in the micro data towards the latter part of the series. A note of caution should also be raised here concerning the comparability of the data for the year 2007, the first year of the new survey GEIH. Labour income amounts are substantially higher than the previous and following year, especially in the top ventile, reflected not only in the upper panel of Fig. 3, but also in the highest number in the National Accounts comparison and in the exceptionally high Gini Index for this year.
1 Carrying out cross-sectional household surveys, has a long tradition at the National Administrative Department of Statistics (DANE) of Colombia. Since the late 1960s, the institute is regularly surveying its population with labour market, living conditions, income and expenditures questionnaires. By the early 2000s, three major household surveys were collecting information on living conditions: the Continuous Household Survey (ECH), the first continuous survey representative at the national level starting from July 2001, the National Survey of Income and Expenditure (ENIG) and the Survey of Living Conditions (ECV). In 2006, those three surveys were integrated in the Great Integrated Household Survey (GEIH), also collected in a continuous mode, with the monthly microdata being available from 2007.
2 Under the assumption that pensions received are subject to withholding deductions, pension amounts were grossed up to include both the 12% health contribution, and the withholding income tax, taking into account fiscal rules concerning income brackets and the corresponding tax rates, as well as the exemptions, deductions and maximum payments for contributions. See Tax Statute (Estatuto Tributario) and Ministry of Health and Social Protection (Ministerio de Salud y Protección Social).
3 More precisely, following the social security financing rules, a 4% health contribution was calculated for all taxable wage earnings, and a 12% health contribution was calculated on taxable self-employment earnings and on taxable pensions, again. The procedure for the estimation of the pension contribution paid on earnings differed between the ECH and the GEIH. In the latter, the information on whether individuals were paying pension contributions on their labour earnings has been used to only apply the formula solely on the earnings of those who reported having paid such contributions (in the amount of 4% for wage earnings and 16% for self-employment earnings); on the other hand, in the absence of the information on the payment of pension contributions, for the ECH series it was assumed that such contributions were paid only on wage income (this followed from the recognition that in the GEIH most self-employed persons reported not paying social security contributions). Income taxes paid on total taxable income were estimated based on the tax rates of the corresponding income brackets for each fiscal year. Overall, we are rather confident of the methodology applied thanks to the detailed level of documentation available from official sources.
4 Another peculiarity potentially impacting comparability arose from the high percentage of item unit non-response in the raw income data (giving rise to percentages of households with missing total income well above 10 per cent and in some years close to 30 per cent). For this reason, we resorted to impute the missing income value. Hot-deck imputation techniques were thus applied to fully impute the missing cases for each individual income item.