Issue, No.5 (March 2018)
Equivalence scales and child poverty: A closer look at different family types across developed countries
According to a forthcoming background paper (Nieuwenhuis et al., 2018)1, it has been evident that families with children are at higher risk of poverty than families without children across developed and developing countries, this is attributed to the costs associated with raising children and fulfilling their needs. A further decomposition of families reveals that single parent households have higher poverty rates and also at greater risk of poverty than coupled households. Single parent households are faced with many challenges, for example being disadvantaged in the labour market which results in limited financial resources (Nieuwenhuis & Maldonado, 2018). For example, in Canada and Unites States, over 50% of female headed families with young children are living in poverty (Nieuwenhuis et al., 2018)). However, in the process of estimating poverty measures, lots of methodological decisions are taken, including choosing the poverty line (relative, absolute), unit of analysis (individual, household) and the choice of the equivalence scale. Consequently, the focus of this article is not only to investigate- for a selected number of developed countries circa 2013- how child poverty levels differ in single parent households compared to coupled households, but also to further explore the effect of using different equivalence scales both on the level of poverty and the rank of countries.
Due to economics of scale in consumption, the need of a household does not increase linearly with each additional member. Therefore, equivalence scales have been developed to realize this adjustment. In this article, three of the most commonly used equivalence scales will be examined; namely: LIS scale = the square root of the number of persons in the household; OECD modified scale = 1 (for the household head) + 0.5 * number of other adult members + 0.3 * number of children below 14; and the OECD original (old) scale = 1 (for the first adult household member) + 0.7 * number of other adult members + 0.5 * number of children below 14. The difference between these equivalence scales, can also be expressed in terms of equivalence elasticity (ε) as the power by which economic needs to change with household size, the equivalence elasticity varies from 0 (full economics of scales, no adjustment for household income) to 1 (no economics of scales, per capita approach).
| equivalised household income | = (Disposable household income)/ (#of HH members) ^ε |
In this article, poverty among children is measured on the household level where a household is considered poor if its annual equivalised disposable income is less than 50% of the median of the national annual equivalised disposable household income (DHI), the household weight is adjusted by the number of children less than 18 years old in the household2. Accordingly, to address the article questions, child poverty rate will be measured using the 3 scales for 18 selected developed countries covering (Anglo-Saxon countries, Continental Europe, Nordic Countries, Mediterranean Countries) circa 2013 from the LIS database. Family types are categorized into 5 groups (Coupled HH with 1 child, Coupled HH with 2 children, Coupled HH with 3+ children, Single parent HH with 1 child, Single parent HH with 2 + children). It should be noted that both coupled and single parent households could include other resident members whether relatives or non-relatives.
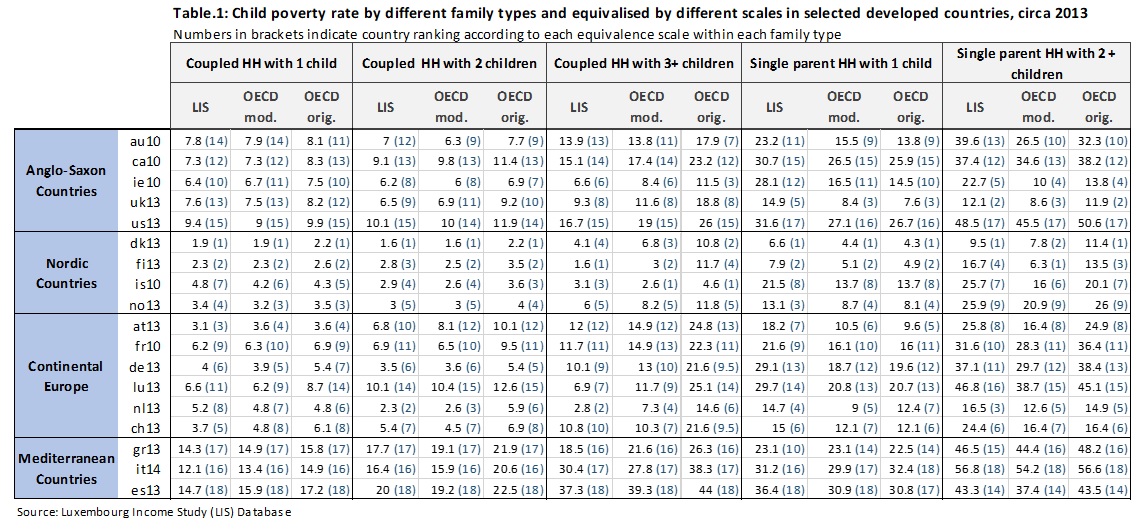
Table 1 compares child poverty rates across different countries and between different family types using the three equivalence scales. From this table, we can observe several patterns: 1) across different family types and for the three equivalence scales, child poverty rates in the Mediterranean countries are the highest followed by the Anglo-Saxon block, while poverty is lowest in the Nordic countries. 2) across different family types, single parent households scored the highest level of poverty compared to coupled households, for example in the United States, the child poverty rate ranged between 27 to 32% -according to different scales- in single parent households with one child compared to approximately 9% in coupled households with one child. 4) the effect of using different equivalence scales is barely noticeable in the case of coupled households with less than 3 children, while much more prominent in coupled households with 3+ children and single parent households. 4) The country ranking according to each scale change tangibly in the case of coupled households with 3+ children and single parent households with one child.
In order to concisely capture how the child poverty rate changes with the equivalence scales and across different family types, percent point differences are calculated. Figures 1a and 1b summarize this effect. Both figures set the LIS scale as benchmark. The differences signal that the effect of changing the scales is substantial for single parent families with one child. The poverty rates are greater using the LIS scale as compared to using the OECD scales, the average difference is approximately 5 percent points, with the highest difference in Ireland as child poverty using the LIS scale reaches 28.1% compared to only 14.5% using the OECD scale. This exhibited pattern can be largely explained by the fact that the OECD scales assume higher elasticity than the LIS scale3, which implies lower economics of scale and means that small households need less income to obtain the same standard of living, resulting in shifting more households out of poverty by increasing their equivalised income.
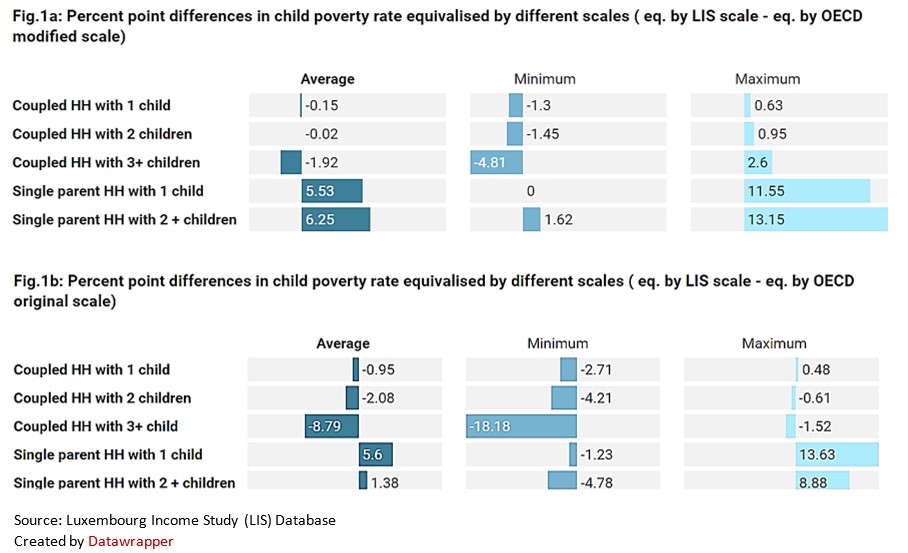
A similar pattern with an opposite direction is observed for coupled households with more children, where child poverty rates are higher using the OECD scales compared to the LIS scale, with an average of approximately 9 percent points when comparing the LIS scale to the OECD original scale, the highest difference is observed in Luxembourg with 7% compared to 25%. This increase in poverty, when equivalising with the OECD scales is because these households are composed of larger number of both adults and children, for which the OECD scales assign high weights causing the overall equivalence factor to be larger than the factor of the LIS scale. These households in turn end up with lower amounts of equivalised household income and hence fall below the poverty threshold.
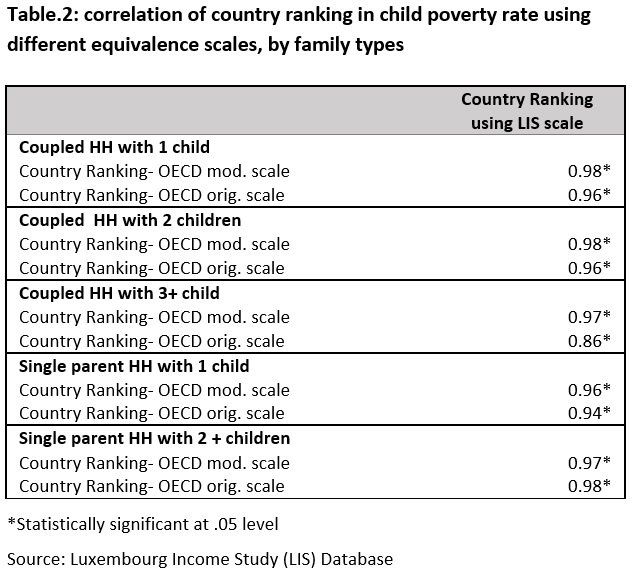
In cross country comparisons, not only the level of the poverty is the core of the study but also how the countries rank with respect to the poverty and inequality measures. Table 2 presents the pairwise correlation between the LIS scale and OECD modified scale / OECD
original scale across the different family types. Overall, the degree of agreement in country ranking between LIS scale and the OECD modified scale is very high reaching ≈97%, with the lowest correlation detected in single parent household with one child. While the correlation is less strong between the LIS scale the OECD original scale, with the lowest correlation in the case of coupled households with 3+ children (Pearson correlation coefficient: 0.86).
In conclusion, different equivalence scales can have a strong impact on the measured level of poverty, particularly when decomposed by different family types. As indicated, single parent households and larger coupled households are more sensitive to these changes. However, the sensitivity analysis suggests that the change in the equivalence scale does not affect country ranking as such. That being said, selecting the equivalence scale should be implemented with care, as this selection affects poverty and inequality levels. Taking these methodological implications into account, enables better shaping of relevant policy recommendations.
1 Background paper commissioned by the UN Women for the progress of the world’s women 2018 report accessible here.
2 LIS provides child poverty rates among its key figures for all the available countries/years through its search engine tool.
3 Equivalence elasticity for the OECD original scale=0.73, OECD modified scale = 0.53, LIS scale=0.5.
References
| Anyaegbu, G. (2010). Using the OECD equivalence scale in taxes and benefits analysis. |
| Buhmann, B., Rainwater, L., Schmaus, G. and Smeeding, T. M. (1988), Equivalence Scales, Well-Being, Inequality, And Poverty: Sensitivity Estimates Across Ten Countries Using The Luxembourg Income Study (LIS). Database. |
| Nieuwenhuis, R., & Maldonado, L. (Eds.). (2018). The triple bind of single-parent families: resources, employment and policies to improve wellbeing . Bristol, policy press. |
| Nieuwenhuis, R, Munzi, T., Neugschwender, J., Omar, H., & Palmisano, F. (2018, forthcoming). Gender equality and poverty are intrinsically linked: A contribution to the continued monitoring of selected sustainable development goals. |
| OECD Project on Income Distribution and Poverty. What Are Equivalence Scales? Paris. |